

I don’t watch much news so I don’t know how much buzz is out there. I did a quick search for XBB and several scare headlines popped up. Saw a couple where it mentioned that it had been nicknamed ‘Kraken’. Is this what we’ve come to now? Nicknames for a virus to make it sound more scary? Maybe this is a good thing because it means they have to take additional steps to drum up panic.
The reality is that we are in what has typically been peak COVID season and the numbers are not increasing and are far, far below the last two winters.
While these may change, the number of newly reported cases for the week ending on January 18th was 332,212 and that was a 24% DROP from the previous week. As a reminder, I’m using CDC data which only updates on Thursdays so that’s why the “week” ends on a Wednesday. In the Omicron wave, this week in 2022 saw 5,629,914 newly reported cases.
To be fair, testing volume has decreased significantly as well so we likely aren’t capturing all of the cases. But it also seems likely that the ones we are missing aren’t serious or severe.
If we go back to the beginning, the first COVID winter wave (original virus) in the US peaked in the week ending on January 13, 2021 with 1,714,377 newly reported cases so we are well under that number as well. So if the “Kraken” has been released, it isn’t making a big impact. It almost looks like we actually peaked the week before Christmas and cases have been going down since then.
The graphs might be useful here as well. CDC regions don’t match mine although there is some overlap. Per the CDC, the XBB 1.5 variant is most prevalent in the Northeast where it now makes up roughly 85% of the COVID cases. In mid December, it was about 20% of cases so it has certainly become the dominant variant. But what happened to overall cases?

Any sign of a large increase over that time period? Nope, the graphs are essentially flat over December and January. So the make up of cases changed significantly over that period but the number of cases did not see a significant rise.
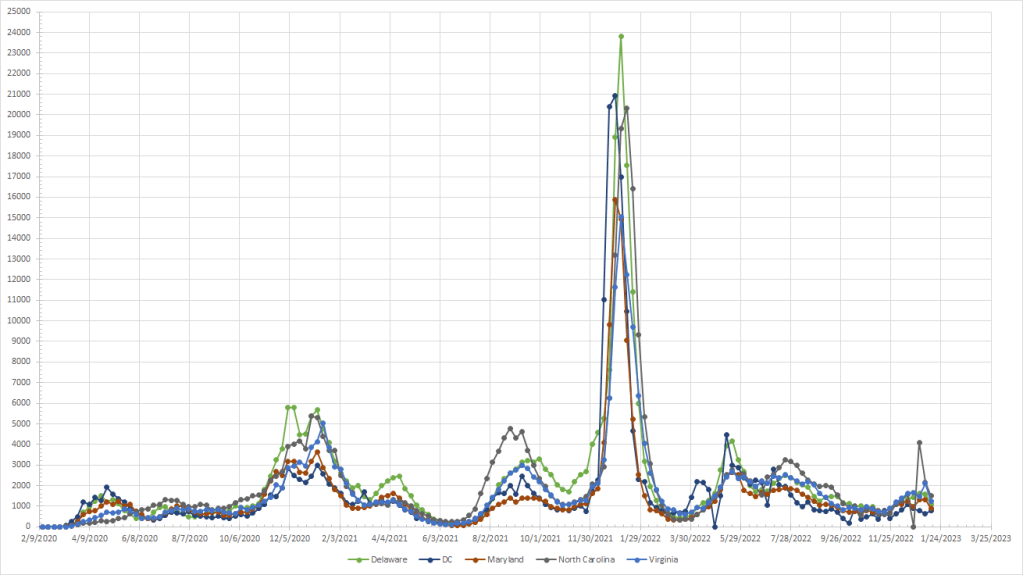
Ignore the spike towards the end of the graph. North Carolina obviously combined two weeks of cases into one data point since they reported 0 one week and then over 4000 the next. Makes the line look odd but the general pattern is no significant increase here as well.

In the Midwest, XBB 1.5 currently makes up about 25% of the cases so lower here than in the Northeast but XBB 1.5 has been rapidly increasing. If anything, the trend here is downward so the current increase in XBB 1.5 hasn’t lead to a spike in cases.

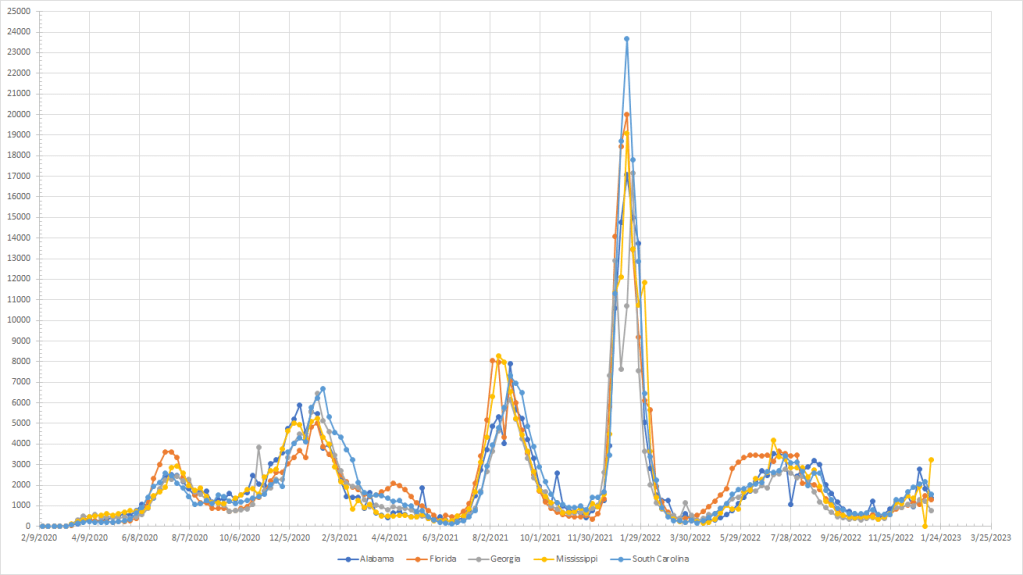
Downward trends in Kentucky, Tennessee and West Virginia. In the deep South, cases had been rising but are still far below previous winter peaks. Haven’t really passed the summer peaks which is different from the previous two years. Not yet enough data to confirm whether cases are now dropping.


More places where we see either a flat line or a downward trend. My regions don’t match the CDC but Iowa, Missouri, Nebraska and Kansas have very low percentages of XBB 1.5 right now – it represents about 10% of the total so far below the Northeast. Hard to pick Missouri and Kansas out from the other states which start to look like the percentage of XBB 1.5 isn’t important in terms of the overall number of cases.
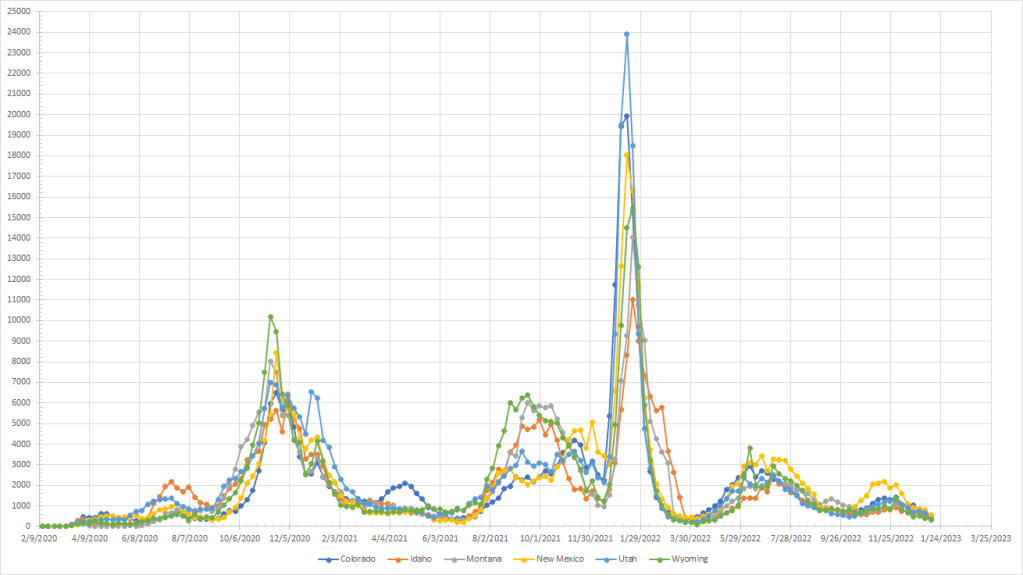
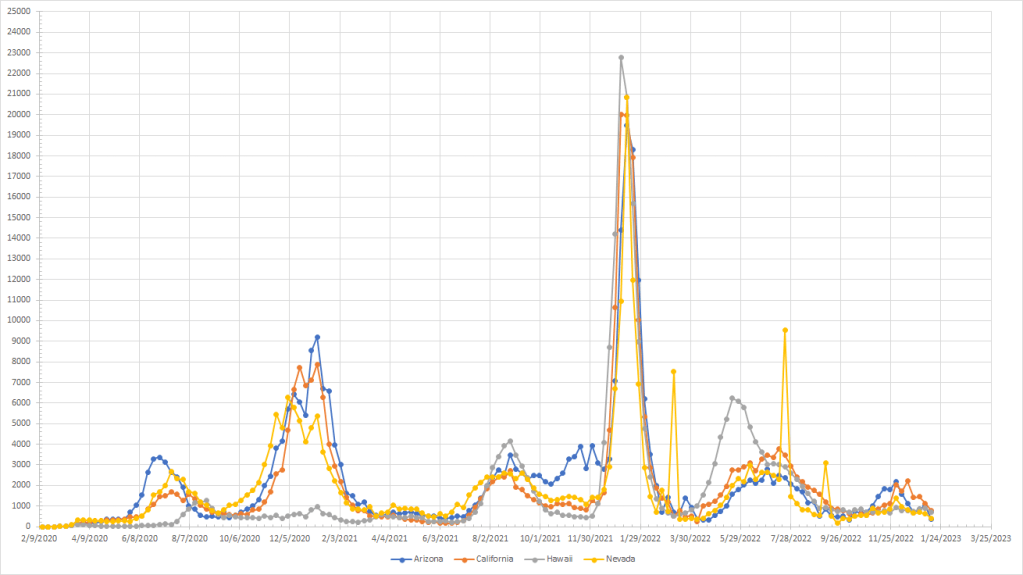
The little waves we saw in Arizona and New Mexico are over as they have come back to the rest of the states in terms of cases. Really looks like downturns everywhere in these two regions. Based on the CDC, XBB 1.5 represents somewhere between 18% and 25% of the cases and has been rising. I don’t have state by state numbers (haven’t fully explored this part of the CDC site yet) but we clearly saw declines in Arizona and New Mexico during a time when XBB 1.5 may have been increasing.
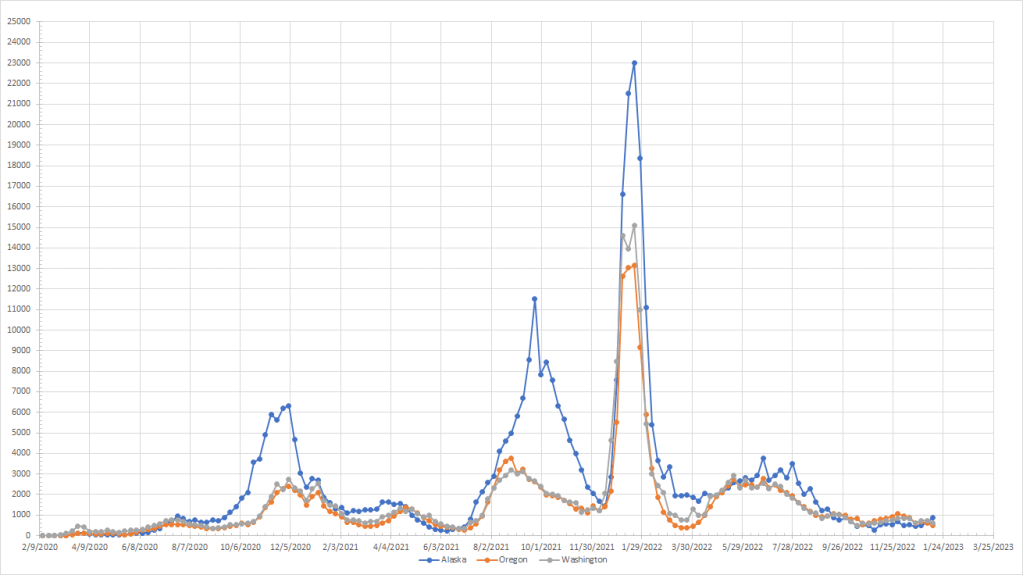
Saw a small increase in Alaska last week while Oregon and Washington were flat.
Bottom line for me is that the stories are focusing on the shifts in the variants and we are seeing this XBB 1.5 take over. But, so far, it has not lead to a big increase in cases. Don’t really see an obvious wave associated with it even in regions where it is now the main variant.
Given that COVID peaked in mid January the last two years, it seems unlikely that we are going to see things turn around and start to climb.
