

There was a big drop in the case numbers last week. For the week, there were 777,837 newly reported cases which was down almost 18% from the week before. It is also the lowest number of newly reported cases since the week ending on August 1.
Last week, we had several states at new highs. Many of them saw a drop in cases. In fact, for the week, only 12 states saw a rise in case numbers. The drops continued to be largest in the South and Southwest but it was not limited to those regions.
Now, this still just may be the calm before the storm. I want to talk a little bit about seasonal patterns with respiratory diseases. Shown below is a chart from Robert Hope-Simpson based on his observations and research into influenza outbreaks. In the northern temperate region, the expectation is that you’ll start to see cases in the early fall but the peak comes in January. In the northern tropical region, you’ll get a peak in December, but you’ll see more activity over the summer.
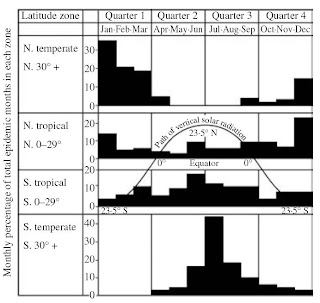
If we go by the 30 degree line, only parts of Florida, Louisiana and Texas fit in the northern tropical region. But based on the data, we do see similar patterns in regions which is why I divided the country up by latitude and longitude. Not sure if longitude really plays a part but it could just be a proxy for distance to the ocean which certainly does influence weather patterns and might play a part. I’m sure altitude also has some part of play but I’m sure it would be much harder to try and define curves based on multiple factors.

The actual data doesn’t exactly fit the Hope-Simpson model but it was close. Last year, the virus showed up towards the end of favorable conditions and the impact was mostly on the east coast. Later, as we moved into summer, the virus took off in the south and southwest. As we moved into fall, it started up in the north and moved down. Many of the northern states peaked in November rather than January and, in fact, by January, the country was actually seeing cases drop. We did see a second summer wave in the south this year that was actually larger than last year but we also saw cases start to rise in August in some northern states which isn’t really consistent with the model but it is still seems to be a good approximation of what to expect.
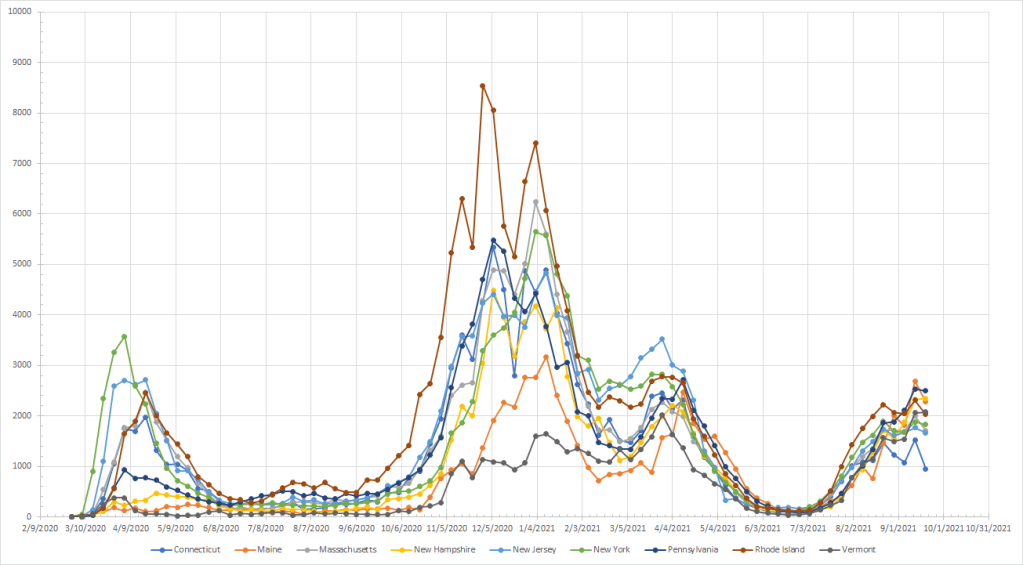
In the Northeast, I just realized that I missed updating the Connecticut curve so it hasn’t shown up in the last couple of posts. Connecticut did see the biggest drop (38%) but the week before looked to be a bit of an anomaly so I don’t make too much out of that. Connecticut does seem to be trending down a bit more than the other states. It is hard to see but cases were down 15% in Maine, 14% in Massachusetts, 12% in Rhode Island, 6% in New Jersey, 3% in New York and 2% in Pennsylvania. New Hampshire and Vermont saw cases increase by 1%.
North Carolina saw cases drop by 42% from last week to this week. That was actually the biggest drop of any state and certainly the largest in this region. Cases fell by 17% in DC and 12% in Virginia. There were small increases in Delaware (0.4%) and Maryland (0.7%). Looking just at week over week change can be a bit misleading. DC has been bouncing and, even with a decrease, the actual number is still not lower than where they were at the end of August. Virginia may have broken out of the plateau to start heading down. Again, North Carolina is the only state that really looks to be in decline. The others all still appear to be in some kind of plateau (with the possible exception of Virginia).

We have some clear distinctions in this region. The three “southern” states in this region saw a drop in cases while the two “northern” states saw an increase. Cases fell by 20% in Indiana, by 18% in Illinois and by 12% in Ohio. This was the first week with a drop in Ohio and I would normally caution against making an inference but the drop was rather substantial and we did see a slow down in the rise last week so it looks to be real. Cases were up 6% in Michigan and 12% in Wisconsin with Wisconsin now taking the “lead” in terms of cases per million in this region. Michigan is still nowhere near the peak they saw in April which just makes me wonder if they’ve already had the big Delta wave and this one will continue to be smaller.

Cases were down in all three states here. They were down 26% in Tennessee, 23% in Kentucky and 12% in West Virginia. That continues the downward trend in both Tennessee and Kentucky. West Virginia is the most “northern” of these three states and the rise there started about two weeks after the other two. I mentioned last week that the wave in West Virginia had been going on for about 10 weeks which was getting near the end so I think the downturn there is real as well.

As I mentioned earlier, the drop in cases continued in the South and cases were down for all five states in this group. Alabama saw cases drop by 40% while they were down 28% in Mississippi and 26% in Florida. Those all ranked in the top 10 in weekly drops. Cases were down by 25% in South Carolina and 20% in Georgia. They all still have a way to go before they get back to the lows in June and I’d expect we will continue to see cases fall in this region.

In this region, cases were down in Iowa (12%), Nebraska (12%) and South Dakota (11%) and up in Minnesota (4%) and North Dakota (12%). North Dakota ranked 2nd in terms of percentage increase in cases. And with Wisconsin and Michigan, there is a little cluster of northern states showing increases. I’m not convinced that the declines in Iowa and South Dakota represent the start of a downturn because they’ve been bouncing around for a couple of weeks. Nebraska may actually have seen a peak.

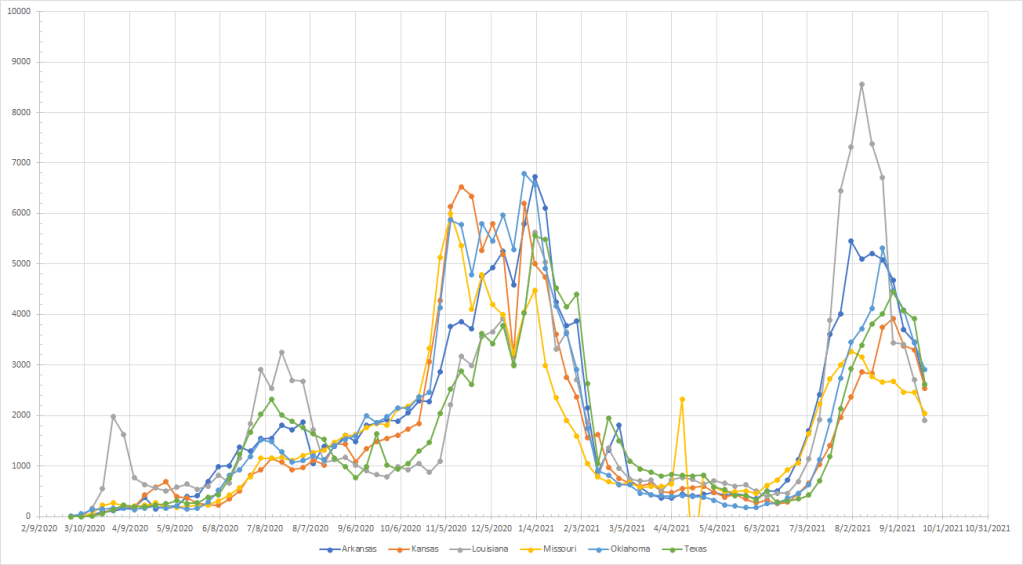
As we move farther south, we have another region where all the states showed a decline in cases from last week. Texas (33%) and Louisiana (30%) saw the biggest drops with both ranking in the top 10. But cases were down in Arkansas (24%), Kansas (23%), Missouri (17%) and Oklahoma (16%). Louisiana which peaked at a very high number back in early August now has the lowest number of cases per million people in this region. Like the South, there is still a lot of room left to drop to get back to the early summer lows.
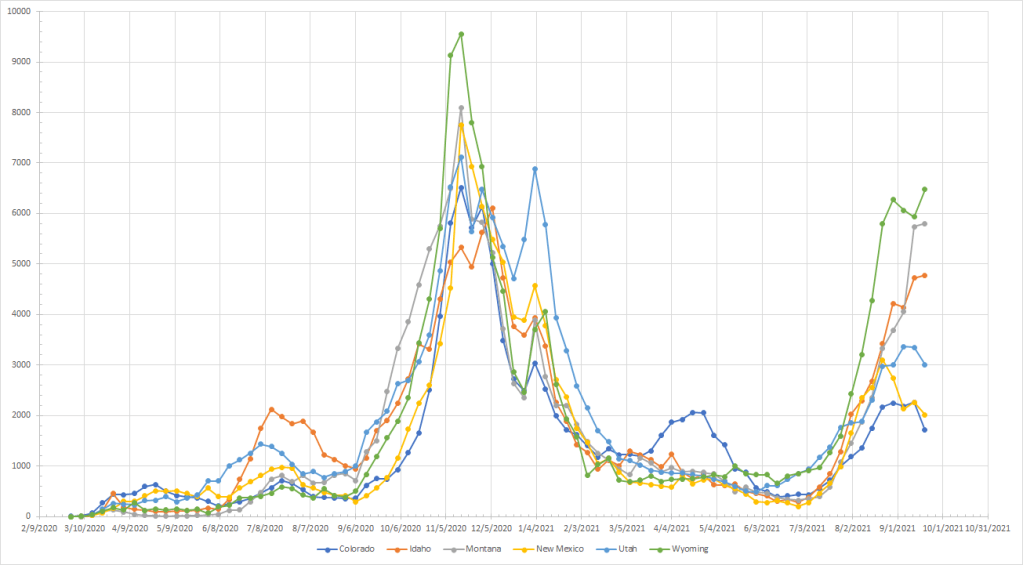
Another area where we have divided results with cases dropping in three states and rising in three states. Cases were down 24% in Colorado, 11% in New Mexico and 10% in Utah. They were up 1% in Montana and Idaho and 9% in Wyoming. Cases had been heading down in New Mexico so that trend is real. Colorado had been flat for four weeks so this might be the start of a down trend. It isn’t clear in Utah – cases were down but the last five weeks have had similar numbers. While cases were up in Wyoming, it also looks like they have been in a flat area for five weeks – the rate of increase is not what it was through August. the other two may now be entering some kind of plateau. But if you colored in the map of states showing an increase, you’d now have a region across the top of the country from Michigan to Idaho where cases were up.
Cases were down in all four states in this grouping. California (34%) and Hawaii (28%) lead the way and both ranked in the top 10. Cases were down 21% in Nevada and 6% in Arizona. Nevada had been in a plateau for eight weeks and it looks like they broke out this week so I suspect we’ll see further declines. Arizona continues to see declines but the rate has slowed and they now have the highest rate of cases per million in this region.

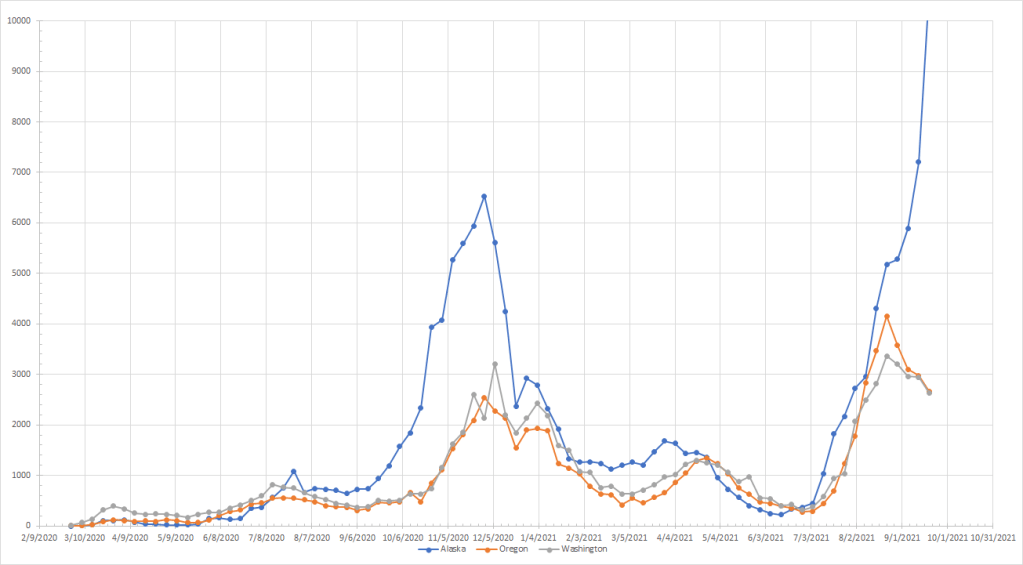
Cases were up 46% in Alaska which is the largest increase among the states. Cases were down 11% in both Oregon and Washington. I’ve capped the graphs at 10000 per million and the actual value for Alaska was 10542 so the point is off the graph. Alaska is interesting because cases have now been up week over week for 14 weeks in a row which is long for a wave. Even if I restrict it to “big” changes, the wave is 11 weeks. The jump last week was rather large and I just wonder if there was some other factor helping. I would actually expect things to start back down relatively soon. Washington and Oregon have been trending down for five weeks although the rate of decrease is not as large as we see in other places.
Last year, we saw similar increases in the northern states. Given that several of these states don’t have a lot of people, it didn’t really become obvious until the first week in October. And then we saw things take off from October through the end of the year. But we have a lot of states seeing declining cases numbers and I don’t know if they are going to rebound that quickly.
Based just on case numbers, we are higher than we were last year at this time. Last year, things were trending upwards. Right now, they are trending downward. The seasonality patterns suggest we haven’t seen the worst so I guess we just wait and see.
