

The CDC update was delayed due to Thanksgiving but I’ve got the most recent numbers and there was an increase in cases so maybe it is worth looking at the data again. Last year, the Omicron wave ran through December before peaking in mid January so it would not be shocking to see cases continue to go up. Winter is the peak season for respiratory infections after all.
But it is likely that we won’t come close to last year’s peak. As I think I’ve said before, my plan was to just follow through the winter and, if all we see is a mild increase, then it will just be time to put away the data.
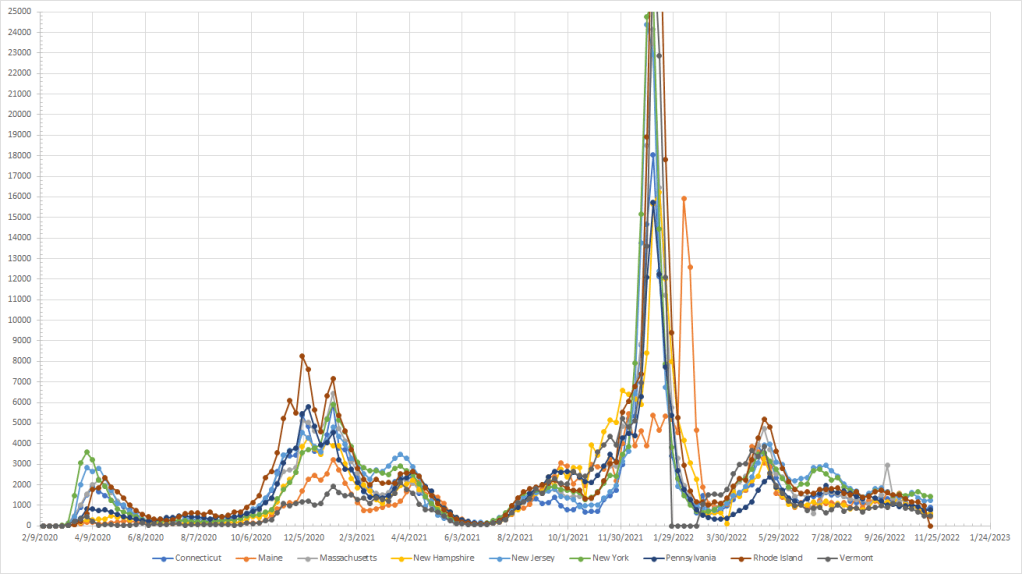
Rhode Island and Mississippi did not report any new cases last week so they will show up as outliers on the various graphs.
For the week ending on November 23rd, there were 305,082 newly reported cases and that was up 8.3% from the week before. It is also the highest total since the week ending on October 5th. And cases have now gone up four of the last five weeks but that isn’t unexpected given that we are moving closer to peak season for this type of thing.
And, for comparison, last year at this time we had 669,179 newly reported cases so cases are down over 50% from last year. Flash back to 2020 and we had 1,252,299 newly reported cases during this week in 2020. As long as testing continues, we will never get to zero but we are certainly in a much better place than we’ve been.
Ignoring Rhode Island and Mississippi, cases were down in 18 states and up in 30 plus DC so the majority of states saw an increase last week.
I’ll go through the region by region graphs because they help show where we are and where we were. In the Northeast, things have been improving in Maine, Vermont and New Hampshire where cases dropped last week and both Maine and Vermont are among the ten states with the fewest cases. New York and New Jersey continue to have high numbers of cases as both rank among the ten states with the most cases so this region is splitting a bit.
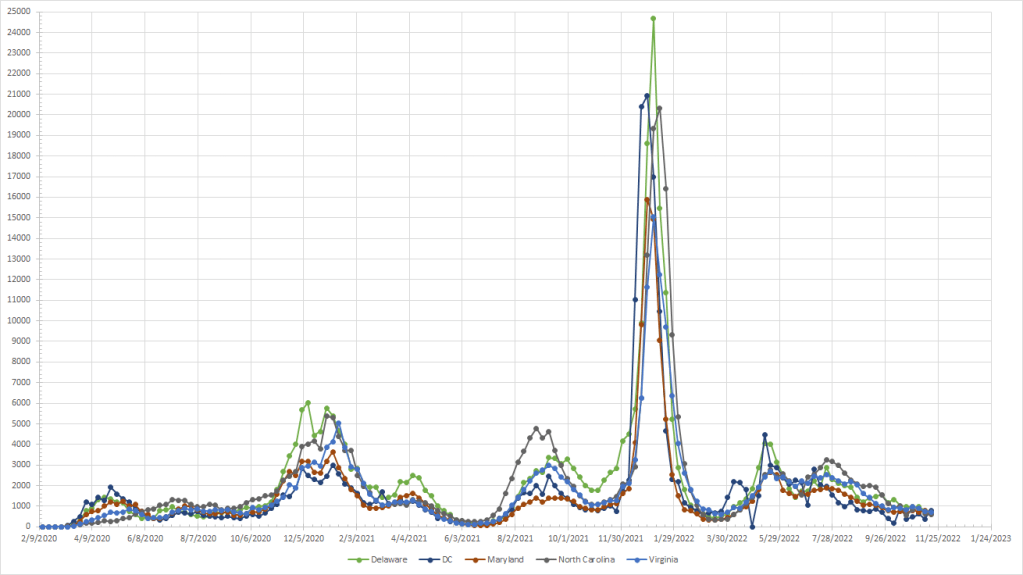
In the mid-Atlantic, by number of cases, the states are North Carolina (11), Maryland (15), Virginia (18) and Delaware (20). DC ranks 27th and was the only one in this region where cases increased last week.
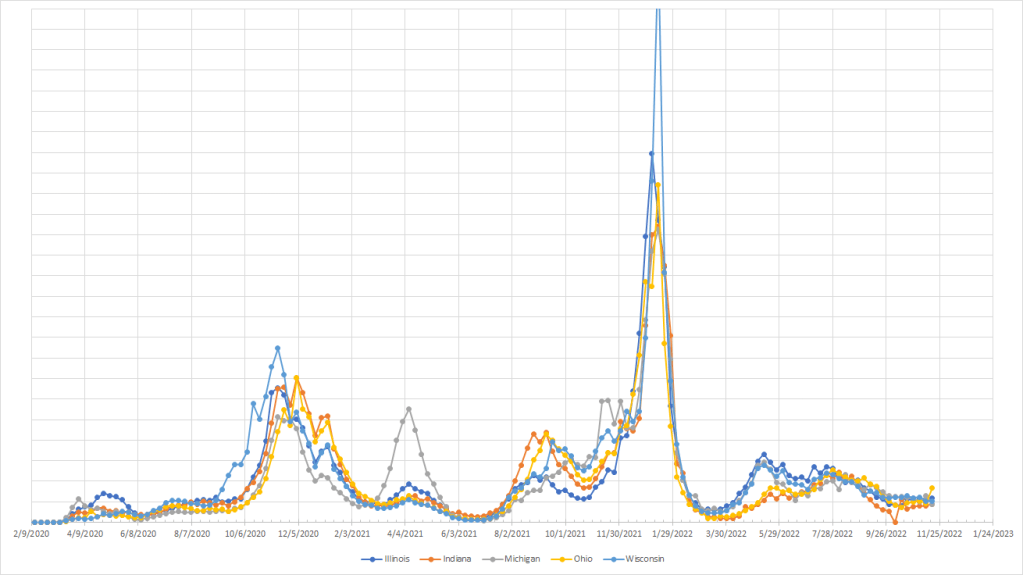
In the Midwest, the five states ranked by cases are Indiana (31), Michigan (32), Wisconsin (39), Illinois (44) and Ohio (49). Two rank in the top ten for the most cases and all are above the median. Michigan comes off as the best because cases dropped there last week. But, like Ohio, we need more data to know if that is a real trend.
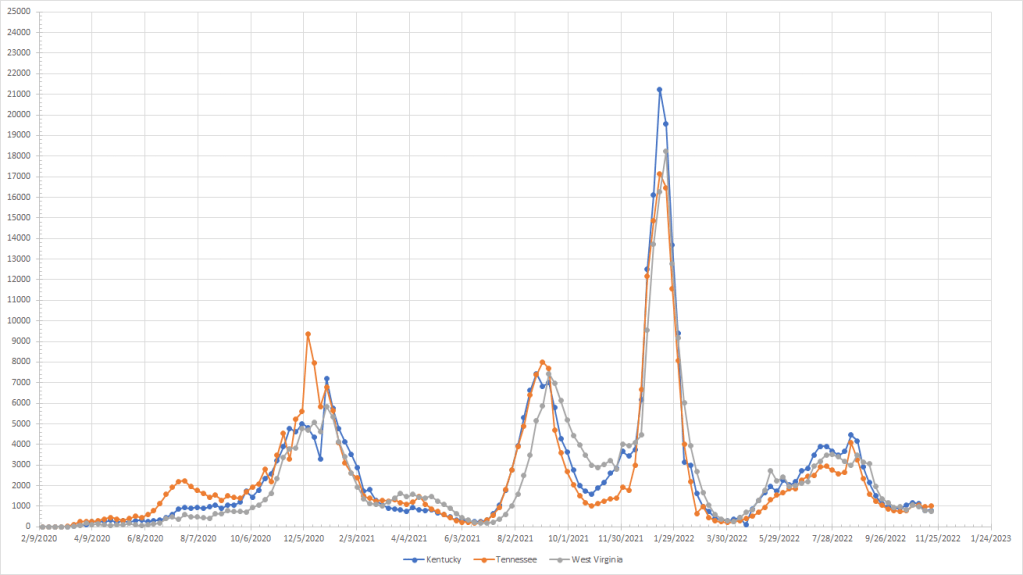
In this next group, things have been improving in Kentucky which now ranked 25th in terms of cases last week. West Virginia was slightly better ranking 21st while Tennessee ranked 37th and also saw cases go up more than the other two so it is the worst of the three. Although, while you can see the separation in the graph below, the difference doesn’t look large compared to the rest of the graph.
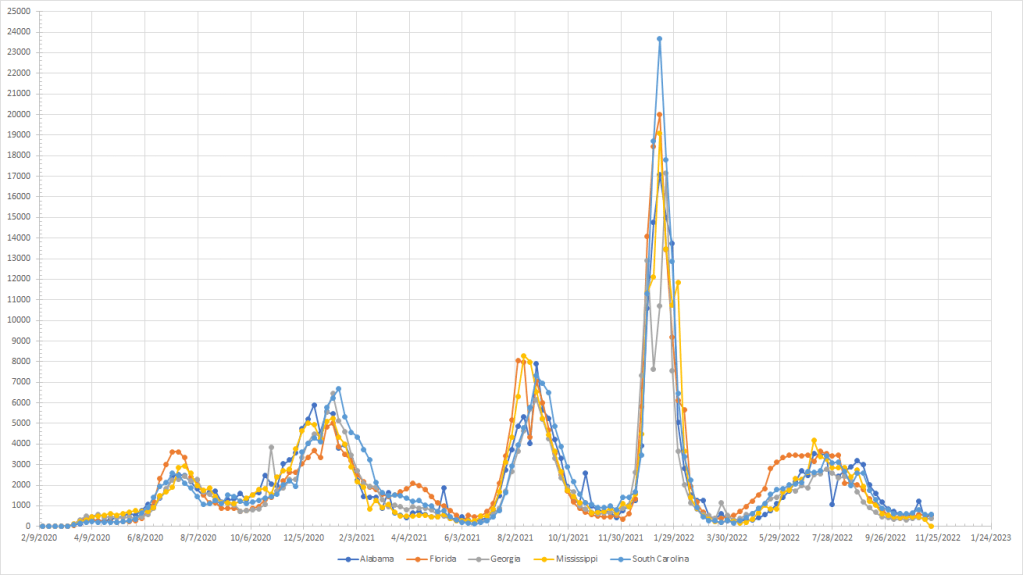
The Southeast is in the best shape. We have to ignore Mississippi but the other states also have low totals – Georgia (3), Florida (7), Alabama (9) and South Carolina (12). I should point out that I still ranked Rhode Island and Mississippi, so Georgia actually had the lowest total in the nation if we ignore the two zeros that aren’t real.
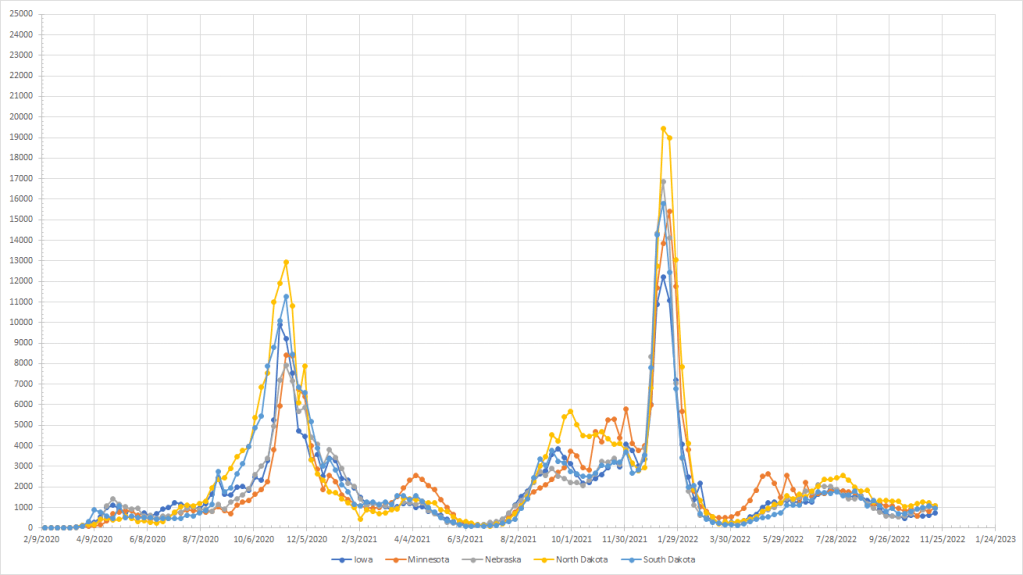
In the upper plains, we do have some divergence as well. Iowa ranked 19th in terms of cases and that was the best in the region as the others were all high – South Dakota (35), Nebraska (41), North Dakota (42) and Minnesota (43). But cases rose in Iowa and Minnesota while they were falling in North and South Dakotas. On the graph it is really hard to pick out any trends so the whole region seems to be flat since late September.
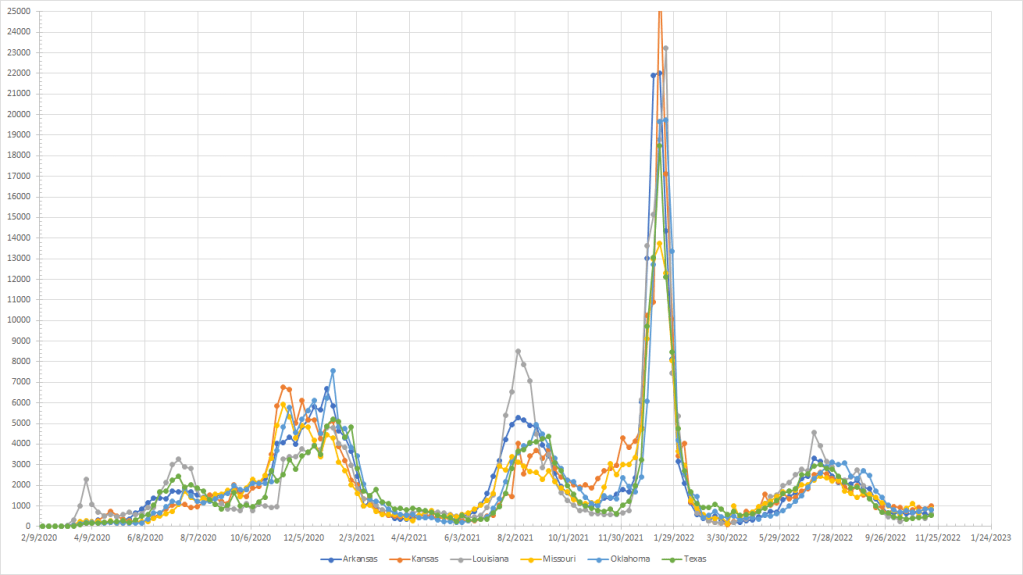
This next region is also a mixed bag. Cases went up in Louisiana, Texas and Kansas and all three saw large increases relative to the rest of the country. But cases dropped in Missouri, Oklahoma and Arkansas. In terms of the number of cases, they fall out like this – Texas (6), Arkansas (8), Louisiana (14), Oklahoma (28), Missouri (30) and Kansas (36). Despite the big increases, Texas and Louisiana still rank low. Kansas looks a bit more like the states in the previous region but, on the graph, the separation doesn’t look that large.
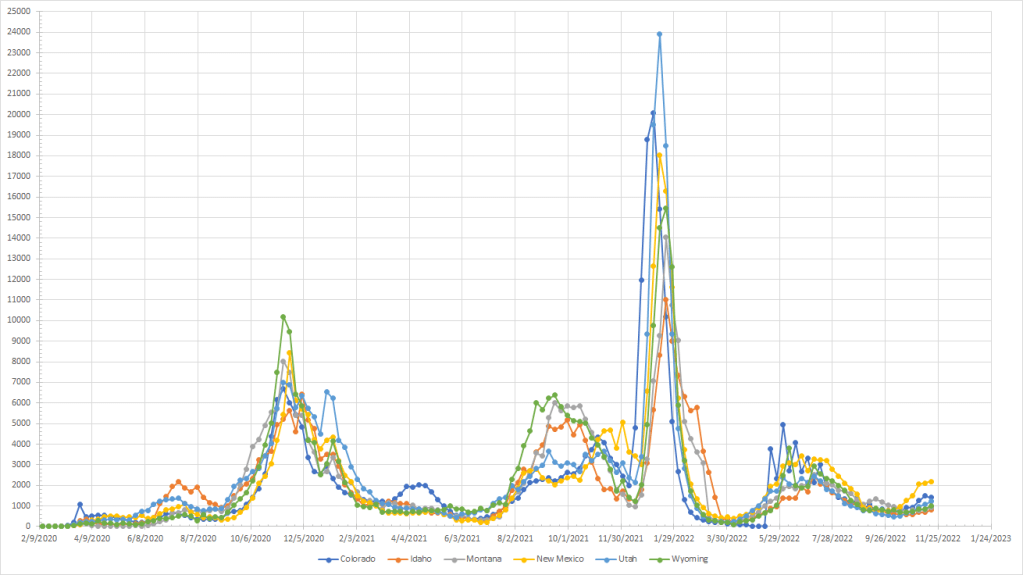
In the Rockies, only Colorado saw cases fall last week but they ranked 47th in terms of cases, so their numbers were still high. The rest of the region was Idaho (26), Montana (33), Wyoming (38), Utah (45) and New Mexico (51). So Colorado, New Mexico and Utah ranked among the top 10 and all were in the top half.
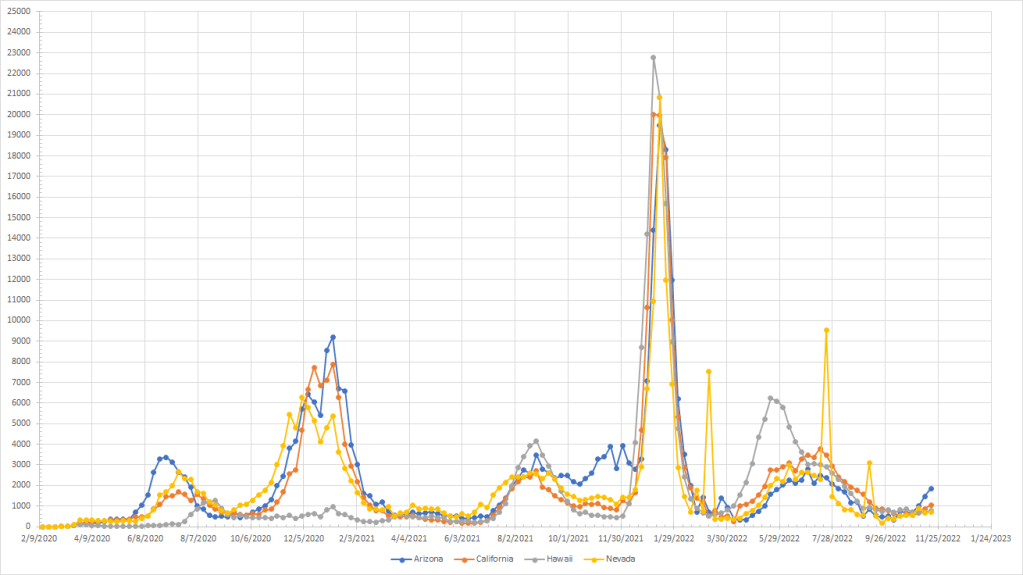
Cases were up in all four states in this group but they were widely spaced when looking at case numbers – Nevada (17), Hawaii (23), California (40) and Arizona (50).
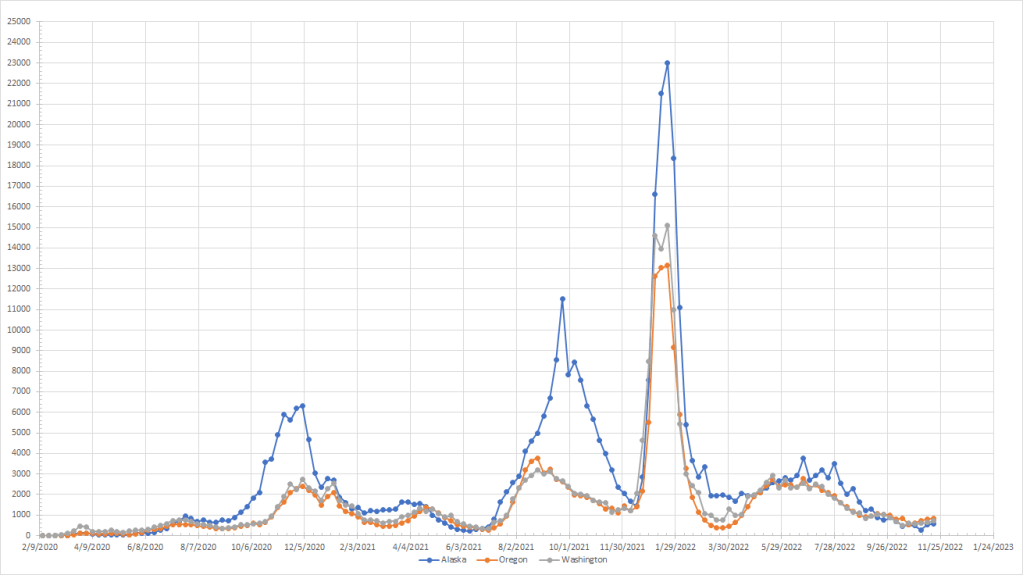
In the Pacific Northwest, cases were up in all three states. But Alaska (10) and Washington (16) still had relatively low numbers. Oregon (29) was a little higher than the other two even though it is hard to see on the graphs.
In looking at all the graphs, it is hard to pick out real trends even in the states where cases were rising. Arizona may be the exception but it could also end up similar to New Mexico where we saw cases rise for a few weeks and then start to level off. As previously mentioned, it would not be a shock to see cases continue to rise in the north as we move into December. But, compared to the previous two years, cases are significantly lower so maybe any wave we see will be blunted as well.
