

The top line summary is that cases continue to fall. The decline continues to be slow and gradual unlike earlier waves which kind of collapsed after hitting a peak. The current numbers are the lowest since early May but still above the lows of the year which were came in late March.
To update the numbers from the last post, the newly reported cases rose from 579,706 to 620,887 and that still represented a 6% drop from the previous week and, as mentioned above was the lowest number of newly reported cases since the first week in May when there were 498,785 newly reported cases.
The preliminary numbers for this past week were 552,950 newly reported cases and that would be an 11% decline. But with lots of missing data due to Labor Day, that number will increase. It isn’t going to rise enough to be above the previous week and that would make seven weeks in a row of declining cases.

Mississippi is not on the chart shown above. They are moving from daily reporting to weekly and saw an increase of over 100% last week and that is more likely a data anomaly so it didn’t make sense to expand the chart. I won’t mention the states with missing data except for the Carolinas which stand out on the graph.
Overall, cases did drop in 33 states and DC. Of the 17 states where cases increased, the longest streak is three weeks of increasing cases in Rhode Island. The numbers for the country as a whole are going to be driven by the bigger states – California, Texas and Florida. That can mask upticks happening in other states which might be a sign of a new upward trend. Given that we’ve been in a decline for seven weeks in a row, it is important to look at the places where cases are going up to see if there are any early indications of a possible new wave.
If I look at change over a longer period, there are five states that currently have totals that are above where they were a month ago. None of them have passed the peaks they set back in the summer so there is not alarming going on right now. The five states are Arkansas, Louisiana, Maine, New Hampshire and West Virginia.
Of those five, West Virginia is closest to the summer peak, so I’ll just show the graph for them (along with the other states in their region).
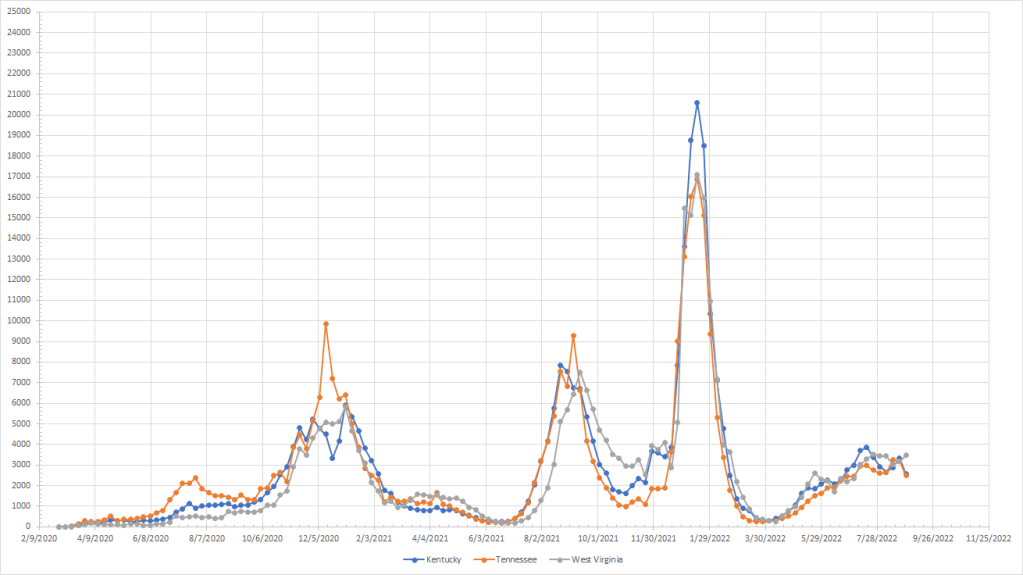
It is a little hard to see but cases have just been up the last two weeks and it is a little hard to get alarmed over a pattern like this. Even if they were to inch back above the late July totals, it isn’t clear if that would be a sign of a new wave.
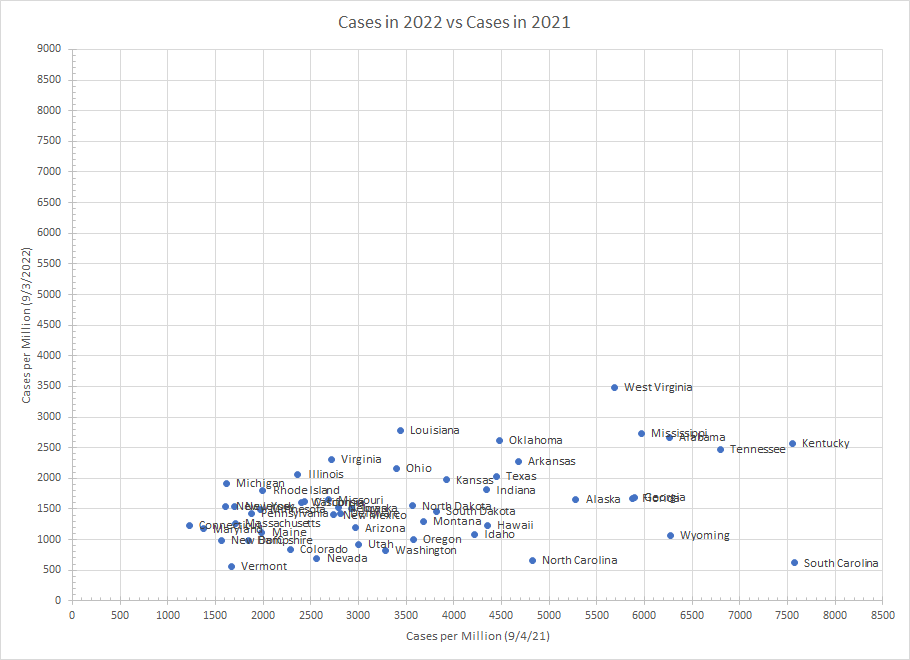
Last year at this time, the country was still in the Delta wave and all states but Michigan and Connecticut have fewer cases than they did at this time last year. As long as the current down trend remains, this will continue to be true and the graphs will continue to look like this. We will start seeing 2021 totals drop because many states peaked right around Labor Day.
With some of the Labor Day disruptions, I won’t list the states with the highest and lowest totals. In reality, as long as cases continue to drop in most places, the lists will be very similar from week to week.
Again, the news continues to be good as cases continue to drop and we don’t yet have any real signs of new upward trends in any state.
