

The general pattern continues with cases dropping almost everywhere. There doesn’t seem to be a new variant hiding and waiting to take over. We are way below last year’s totals but cases haven’t dropped back to the historic lows we saw early last summer. With the newer variants, that may not even be possible. There may just always be some background COVID noise going on until we finally decide it is no longer worth reporting.
Last week, there were 683,165 newly reported cases when I did the post. The updated total is 707,181 and that is still a 12% decline which is the largest weekly decline since back in mid March. For this week, the preliminary numbers are 641,606 newly reported cases and that would be a 9% decline. I suspect that figure goes up so we aren’t seeing accelerated declines like we did when the winter wave ended earlier this year.
Even if the number comes up a bit, it is likely going to be the lowest number of newly reported cases since the first week in May but we are still far above the low for the year which was 180,323 during the last week in March. For comparison, last year at this time, there were 1,043,880 newly reported cases as we were in the Delta wave.
This week the states with missing data include North Carolina, Colorado, Nebraska, Pennsylvania, Washington and DC. So you can essentially ignore them in the following graphs.
Rhode Island is missing from this graph because they had an unusually low total last week due to missing data which came in this week. So they ended up with a 250% increase in cases and I wasn’t going to expand the graphs to cover an obvious data anomaly. Tennessee looks like they had a dump of past data on one day last week so their case numbers and weekly change are likely artificially inflated. Michigan has no obvious explanation.
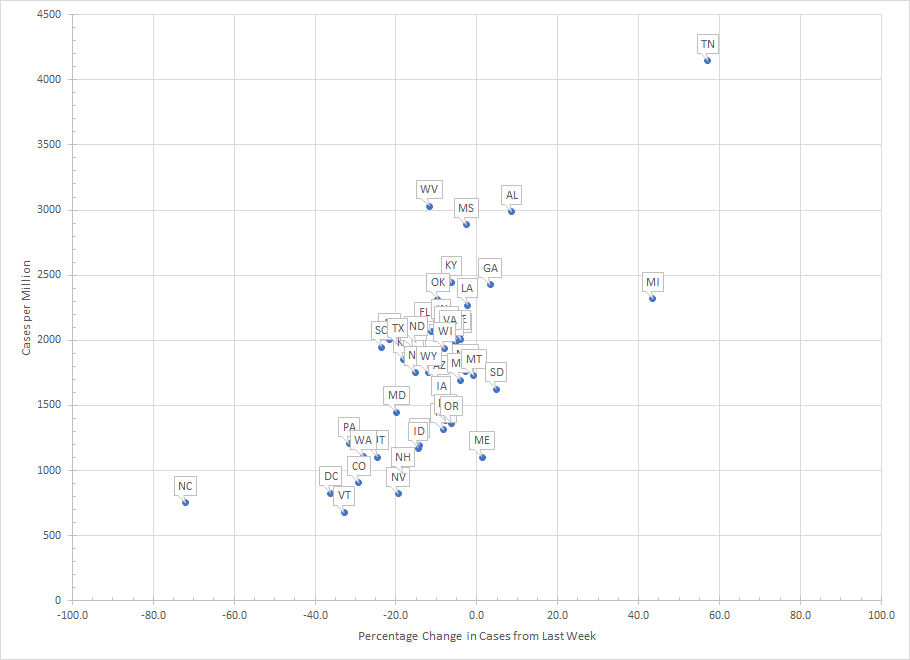
Overall, cases declined in 43 states and DC. Besides the three mentioned above, cases increased in Maine, Georgia, South Dakota and Alabama. But the increases where under 10% in all four of those states. Of those who saw cases decline, the majority saw declines less than 20% so more gradual decreases but clearly the trend is downward for cases.

This graph shows the big year over year differences in the South. There are eleven states where cases are actually higher this year – Virginia, Illinois, North Dakota, Connecticut, New York, Wisconsin, Minnesota, Ohio, Maryland, New Jersey and Michigan. A few clusters in the East and Midwest. We still see a decent correlation between years which is interesting considering that we were dealing with a different variant last year but the seasonality may be the most important influence.
If I ignore the states with missing data, the ten with the lowest number of cases per million last week were Vermont, Nevada, New Hampshire, Maine, Utah, Washington, Idaho, Connecticut, Pennsylvania, Massachusetts and Oregon. Even though Connecticut is above where they were last year, they still have a low number of cases. We see a cluster in the Northeast and one in the Pacific Northwest (stretching to Idaho). Of those, Vermont, New Hampshire, Maine, Connecticut, Pennsylvania and Massachusetts were among the ten lowest this time last year.
The ten with the most cases per million were Tennessee, West Virginia, Alabama, Mississippi, Kentucky, Georgia, Michigan, Oklahoma, Louisiana and Indiana. Florida was 11th but it is the first time they haven’t made the top ten in a bit. Clearly clustered in the South and this will likely remain the case as long as cases continue to drop in the majority of states. Tennessee, Alabama, Mississippi, Kentucky, Georgia and Louisiana were all in the top ten for most cases at this time last year so there is a lot of overlap at both ends of the scale.
The overall pattern though is that cases are dropping almost everywhere. And where they are rising, it does not yet look like a new wave. So we may be in this pattern for a few weeks which is a good thing.
