

I don’t watch a lot of what would be called mainstream news so I don’t know what they are talking about. I did a quick search of headlines and there are a few on the latest and greatest version of Omicron. Many calling it more contagious but just a lot of “what you need to know” type articles. Didn’t read them because I just assumed they really didn’t have anything useful to say.
The big picture view from last week is that cases did rise for the first time and I’m thinking this rise is larger than any corrections so it should hold up. But case numbers remain relatively low and we just aren’t seeing any places where things are taking off.
Edgar Hope-Simpson put together tables showing seasonality of respiratory illnesses. This was back in the early 80’s and April was the tail end of the peak period for temperate regions. We have a few more weeks to go in April so a modest uptick from a new variant isn’t all that alarming. If it is going to become a problem, we’ll probably see it in places like Florida as we move into late spring early summer which is when hot places see a rise in cases.
But for the week ending on April 10th, there were 205,427 newly reported cases and that was up 13% from the week before. It was the highest figure in four weeks. For some visual perspective, here are daily reported new cases (grouped by week) since the beginning of the year.
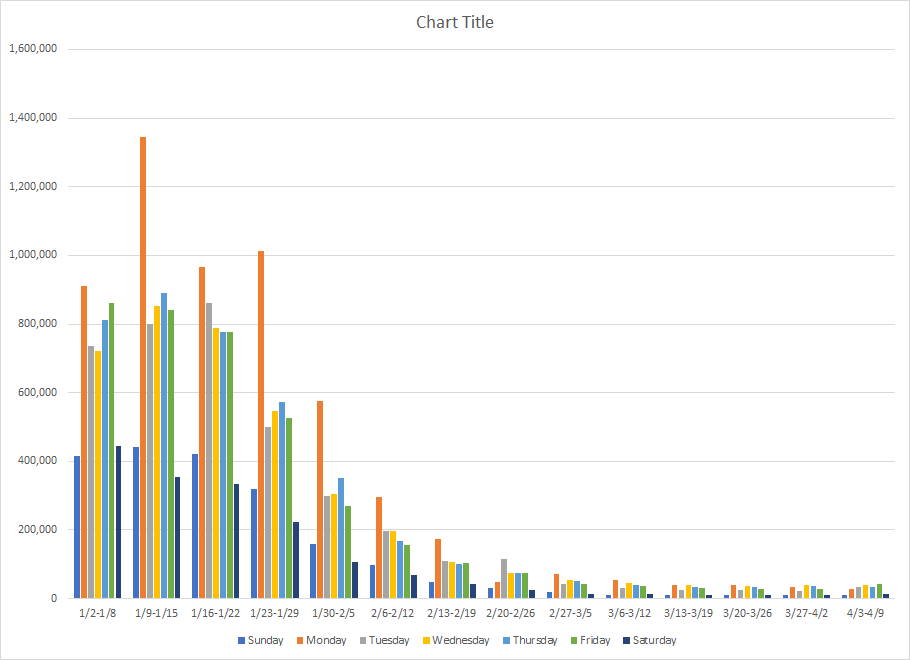
If you look hard enough, you can see the increase but we remain at a very low level.
You can see that on a state level as well. Last week, cases were up in 34 states so a majority saw an increase and we’ve seen that number increase in recent weeks. And we now have 15 states where totals are up from a month ago which is a potential sign of an increasing trend.
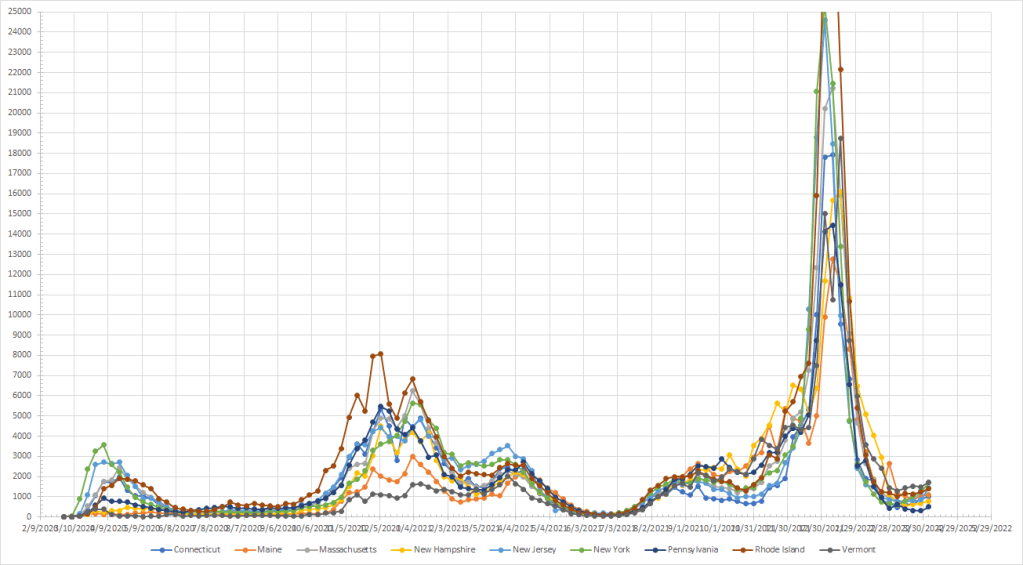
It continues to be centered in the Northeast. The states with the highest number of cases per million last week were Vermont, New York, New Jersey, Rhode Island, Massachusetts, Alaska, Maine, DC, Connecticut, Arizona and Illinois. You got eleven states since DC isn’t a state.
Like last week, I’ll include only the graph for the Northeast. It is hard to see the date range at the bottom (I’m going to have to adjust the scale for readability) but this region also had cases remain elevated in late spring. But the numbers for last year at this time are still higher than they are right now. And, like I said last week, if this is the worst region in the country, then we are in good shape overall.
For the rest of the country, I’ll just use the graph showing cases per million against weekly change. If you’ve followed along, we are seeing more drift towards the left as states start seeing upticks in cases. What we aren’t yet seeing is a big shift to the upper left which would mean high cases and large increases.
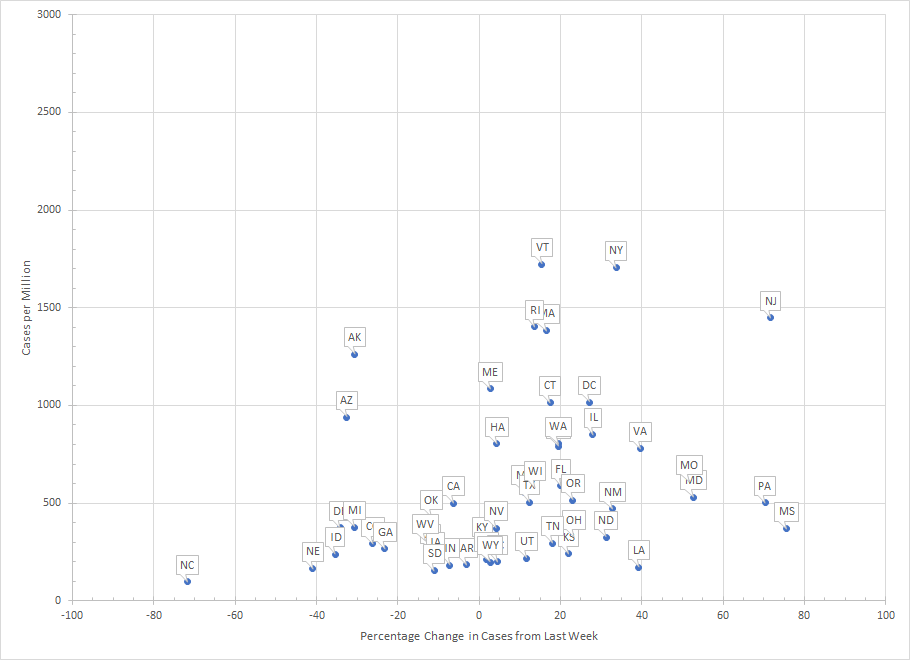
There isn’t really a “good” or “bad” number here. Well close to 0 would certainly be good but how close is close? A little more than half the states had less than 500 cases (per million) last week and all but nine were under 1000 cases. Looking back at the graphs, those are low numbers compared to past periods of rapid rises or peaks.
The story this week is much like last week. We saw cases go up with a lot of the increase centered in the Northeast. But, even there, were aren’t seeing sustained rapid increases and the overall number of cases is not at high levels we’ve observed during past peaks or periods of fast growth. If seasonality is the driving factor, this may hang on for a few weeks before we start to see things drop to early summer lows. All in all, the picture is favorable and doesn’t raise any alarms.
