

I wanted to do this post because the collapse in cases is kind of remarkable. For the week ending on February 13th, there were 1,145,618 newly reported cases and that was down 43% from the week before. That is the second week in a row that cases dropped by 40% and we are now down almost 80% from the peak set in mid January.
As expected, we are also now seeing deaths start to drop. I look at this in two ways. One is the daily numbers put out by the CDC which just count deaths reported on that day. They have another table that shows deaths by the actual date of death. That one lags but both are showing declines. The numbers remain high but the trend is in the right direction.
This is a chart of percentage change in cases vs cases per million. I’ve kept the scales the same as the first time I created this chart a few weeks ago just to highlight the movement towards the lower left corner of the graph.

Pennsylvania actually saw an increase in cases last week and was the only state where that was true. Probably an anomaly but we’ll watch just to be sure. Alaska still has the highest number of cases per million but they are seeing big drops. Cases are still high in Idaho and Wyoming as well. Maine remains an outlier. They never saw a big increase in cases but they also aren’t seeing cases drop so they now rank among the highest in the country.
You have a small cluster of states with low cases numbers moving back towards the 0 line. This isn’t unusual. At some point, it is hard to maintain big percentage drops when the actual case numbers are small. Would expect to see more states start to move in that direction as well but as long as we continue to see declines and actual cases dropping towards zero, it still positive.
The ten states with the biggest drop in cases last week were Oklahoma, Indiana, Mississippi, Rhode Island, Nebraska, Nevada, Arkansas, North Carolina, Illinois and Michigan. Kind of all over the map.
The ten states with the lowest number of cases per million were Maryland, New Jersey, New York, DC, Connecticut, Ohio, Rhode Island, Illinois, Delaware, Nebraska and Indiana. I gave you one extra since DC isn’t a state. Most are in the Northeast where we saw the first big Omicron breakout but it is has started to spread to the Midwest as well.
Not going to do a full ranking but I think the charts are interesting so I’ll just present them without comment just to illustrate the collapse in cases.


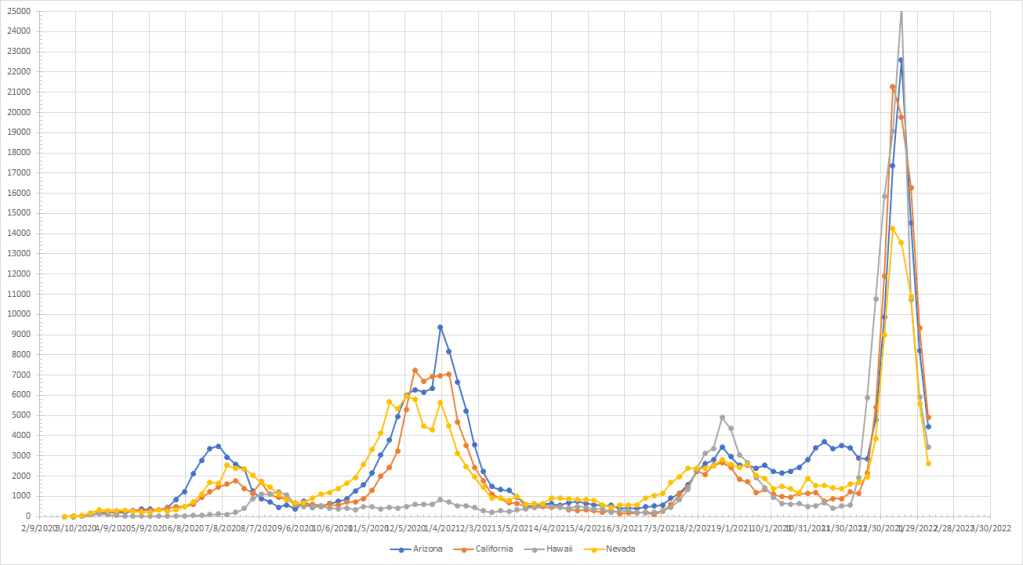

Barring some new variant kicking off a new wave, this one is clearly over and should continue to collapse as we move into spring. Seasonality is a thing.
