

We’ll start with a disclaimer. My “start” and “stop” dates are based on my weekly totals and when I started, I was not aligned with calendar weeks so there are some differences in my dates. The use of weekly totals does mean my dates are not going to be exact. But when I’m making comparisons within the same block, the comparisons are on data treated the same way.
Last year, the wave the primarily hit the South and Southwest started during the first week of June. we had two weeks of modest increases and then four weeks of big (defined as a change of more than 10%) increases and a final week in mid July with a small increase. That’s a total of seven weeks where the weekly case count went from 151729 to 475565.
For now, we are going to ignore that testing also increased substantially over that period and that testing and case counts are related. In the big weeks, case growth outpaced growth in testing so there was clearly something going on.
I made some predictions early on this summer based on last year and quickly discovered that this year was not the same. The wave showed up later and the increases have been larger. The first noticeable increase in cases was during the last week of June and we’ve had big increases for the last seven weeks taking the weekly total from 82221 back in mid June to 876384 this past week.
We have seen the growth rate drop for four weeks in a row and last week the case count only grew by 13% which is the lowest since the first week of the wave. As I’ll detail later, we seem to have hit peaks in at least four states with a few others close. While the case count remain high, the evidence does suggest that the wave is peaking in the South. The worry is that it is picking up in other places where the percentage increase is large even though the actual case count is low.
Most of the country is running above totals from last year at this time with many places running well above. Almost half of the states started to see cases rise during early July which would mean they are still at least 2-3 weeks from peak. For the states that seem to have peaked, the wave lasted 8-9 weeks which is similar in length to last summer but the percentage increase was much larger.
The ten states with the largest number of cases per million last week were Louisiana, Mississippi, Florida, Arkansas, South Carolina, Georgia, Alabama, Kentucky, Oklahoma and Tennessee. The list is still all southern states. For comparison, last year at this time, the top ten was Georgia, Florida, Louisiana, Nevada, Idaho, Texas, Mississippi, Alabama, Tennessee and South Carolina so seven of the ten are the same even though at this time last year, the southern wave had peaked and cases were dropping. That just means we could expect case counts to remain high even if the numbers are falling and not rising.
If we look at the top ten in terms of percentage increase, the list is Michigan, Maine, Oregon, West Virginia, Indiana, North Dakota, Mississippi, DC, Ohio and South Dakota. Most of these states have low case counts but they are where things are growing the fastest. The concern is we just roll from the summer wave in the south to the fall/winter wave in the north.
With the graphs, I’m going to be looking a lot at where the case count is now relative to last year. In almost every state, it is up from where it was. Some of the states had already started to see the beginnings of the fall/winter wave but most hadn’t. So it is concerning to see cases going up in places where seasonality would say they shouldn’t.
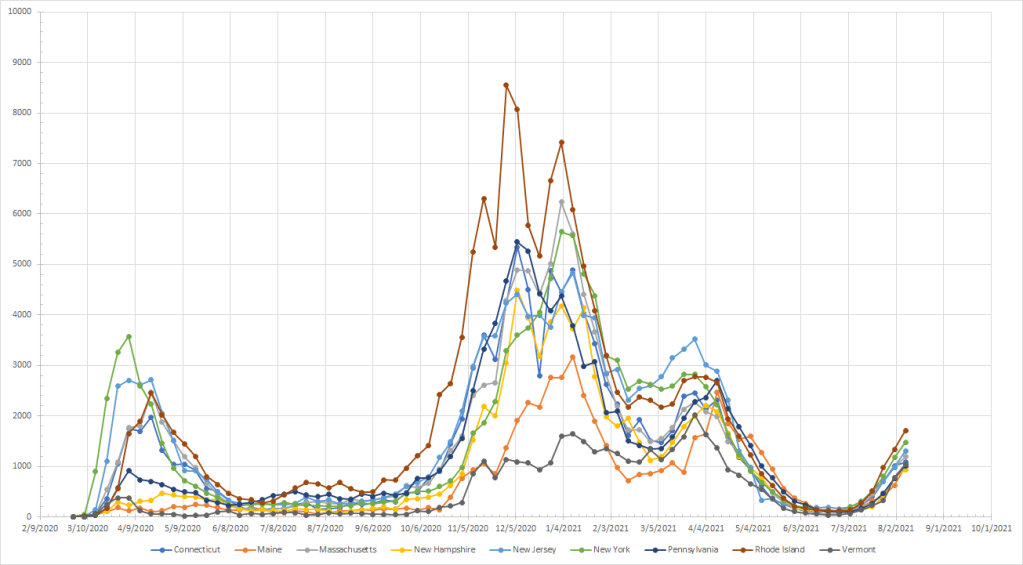
We start in the Northeast where we see all of the states moving up with cases rising since the first week in July. They have not yet reached the April levels but they are all way above where they were last year at this time. In terms of percentage increase over this time last year, these states rank high. Vermont (1), Maine (2), New Hampshire (4), New York (5) and Connecticut (6) are among the highest and Massachusetts (12) and New Jersey (15) rank in the top 20. Rhode Island (22) and Pennsylvania (33) round out the region. I don’t know what this means for later in the winter which is when these states saw the biggest issues last year.
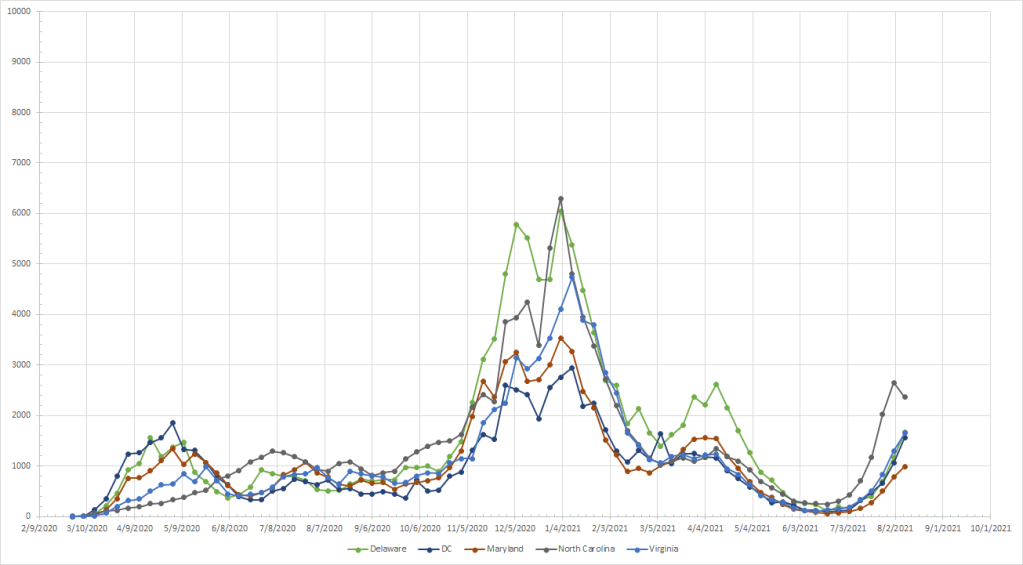
Moving down the coast a bit we get the next group. Because I’m doing this on Wednesday, I have access to data from days that aren’t shown on this graph. Based on that, I believe the North Carolina data is an anomaly and not a true peak. Last year, at this time, these states were all flat while we see increasing case counts in all of them this year. In comparison to last year, the differences are not as large as the Northeast as only Delaware (19) is in the top half of the states. The rest of the group includes North Carolina (26), DC (35), Virginia (36) and Maryland (49). Maryland does seem to stand a bit apart from the rest with a slower growth rate but it isn’t clear whether that will hold up.
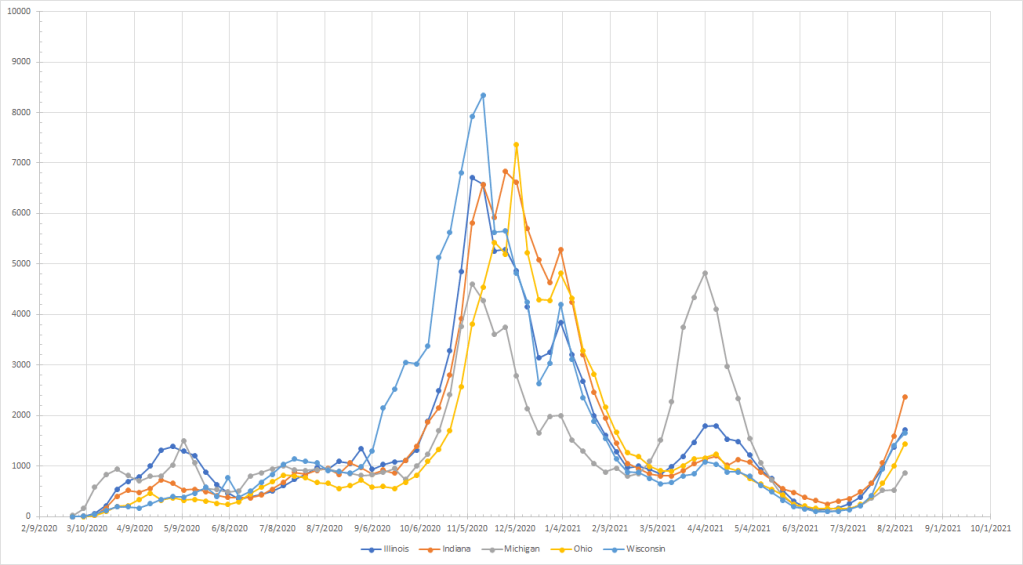
In the Great Lakes region, we again see all states showing an increase compared to last year when they were flat. But none of them rank in the top half of states in terms of increase over last year. Indiana ranks 29 and is the worst of the bunch in terms of growth rate. Since I live here, I can say that a lot of that is driven by the southern section of the state. The others states here are Ohio (34), Illinois (40), Wisconsin (41) and Michigan (51). Michigan is one of only two states that is below last years total. I suspect there is some relationship to the big spike they saw in April – maybe they just got it early. Still, like the other regions, we really didn’t see things pick up last year until September or October so it is a concern that things are clearly trending up now.
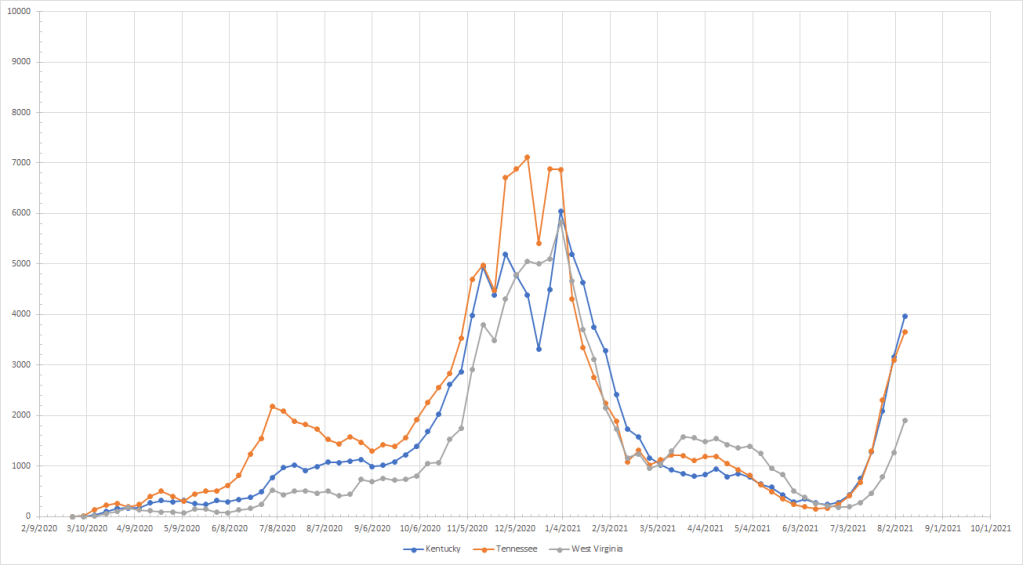
Moving down a bit we get this next group. (A reminder that these state groupings were defined by latitude and longitude) Last year, Tennessee did see an increase and had started to drop by this time while the other two were flat. They are all showing upward trends and are above last year. Tennessee may have slowed a bit since Kentucky passed them in terms of cases per million. West Virginia (16) is actually farther above last year’s total followed by Kentucky (18) and Tennessee (32).
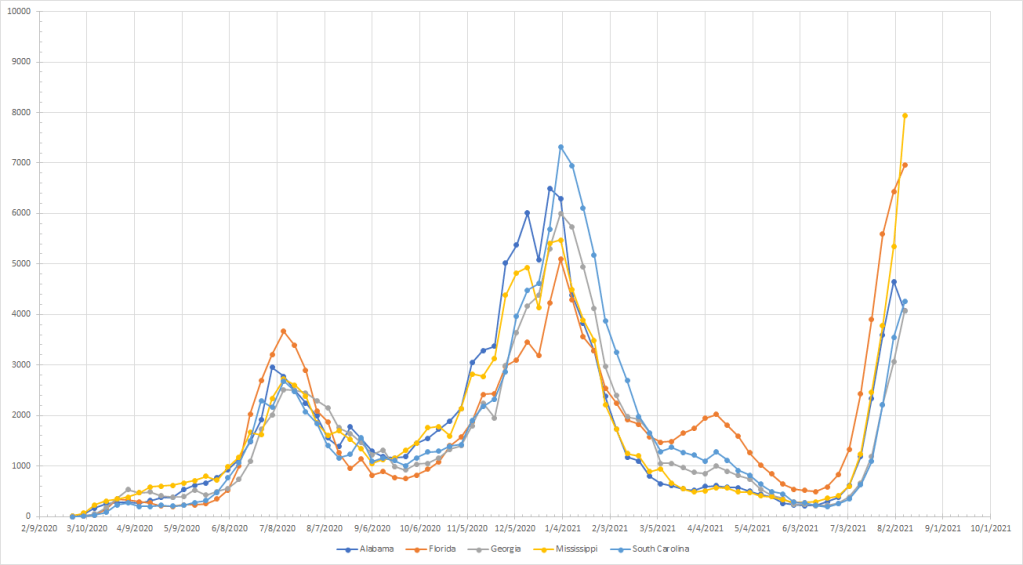
Now we get to the Southeast. Alabama turned down for the week and that does appear to be a real peak. Cases continued to rise in the other states although the rate of change in Florida slowed enough that Mississippi jumped ahead to lead the region. Both Florida and Mississippi are at all time highs for cases per million. Last year, at this time, they had all peaked and were heading down. Mississippi (9) and Florida (17) rank high compared to where they were last year and South Carolina (21) and Alabama (27) are in the top 30. Georgia (39) brings up the rear but Georgia started a little later and we will probably see cases continue to rise there.
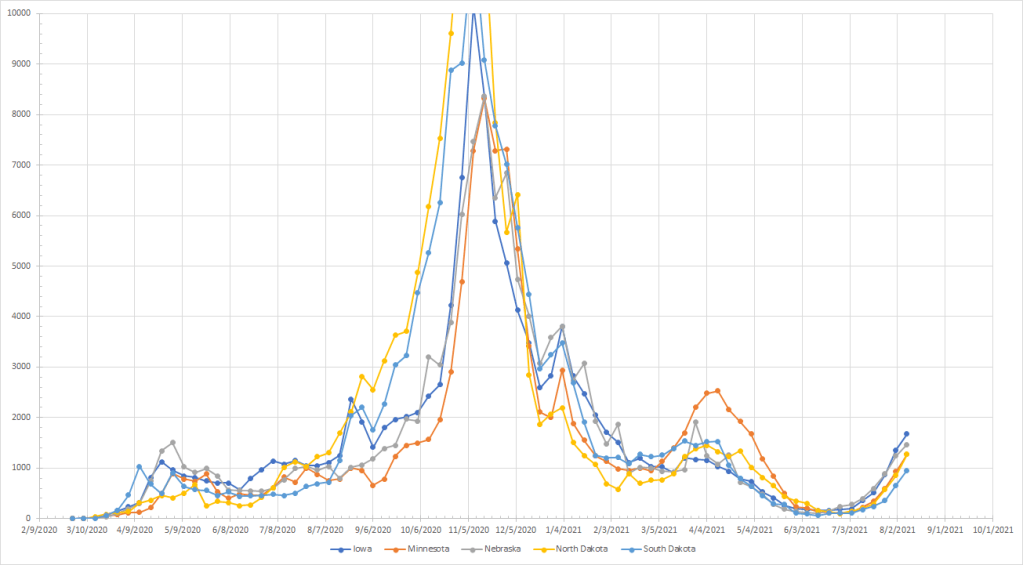
On to the upper Midwest where cases are climbing everywhere. Last year at this time, the fall wave had already started in North and South Dakota. If there is any good news this week, North Dakota (50) is the only other state besides Michigan to be below where they were at this time last year. To temper that, they aren’t that far behind (1269 vs 1300) and given how high cases got there, predicting a repeat of last fall isn’t exactly great news. Still, the entire region ranks low in terms of increase over last year with the rest of the states ranked as follows: Minnesota (42), Iowa, (44), Nebraska (46) and South Dakota (48).
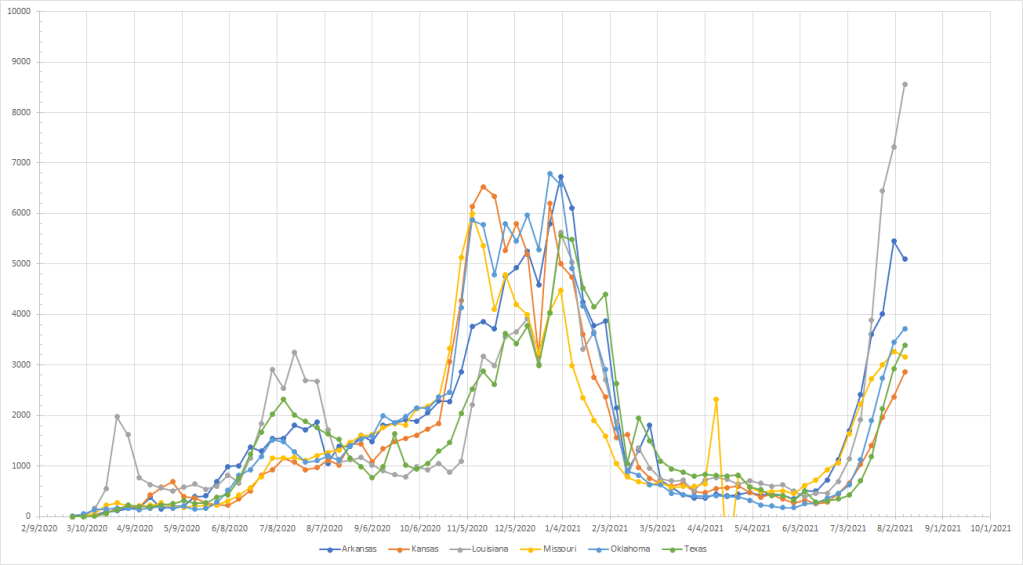
The next region is where I combined a couple of smaller regions because I would have ended up with Kansas and Missouri in one region. Cases turned down in Arkansas and Missouri and those both look like real peaks at this point. Last year at this time the more southern states (Arkansas, Texas, Louisiana and Oklahoma) had dropped from peaks in July while Missouri and Kansas were more flat. Louisiana (8) is the farthest above last year and currently sits at an all time high. There is wide variation among the others – Arkansas (10), Oklahoma (20), Kansas (28), Missouri (30) and Texas (38). Overall, it looks like a region approaching peak values but all of the states are going to see peaks above last summer.
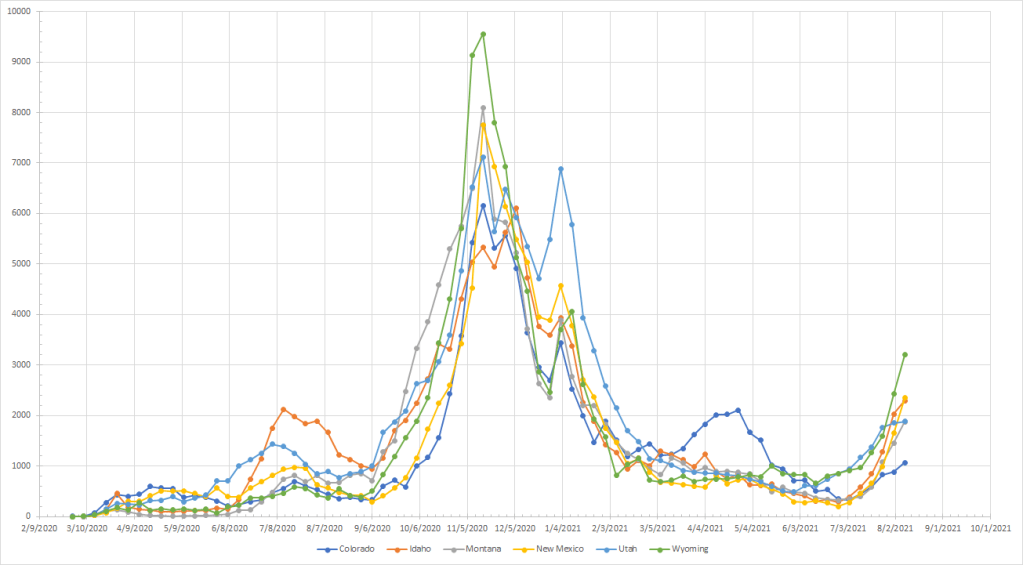
The Rockies are another region with some wide variation among the states. In mid August of last year, cases were basically flat everywhere with the wave starting in September. This year, we see big increases in Wyoming (3) which is way above where they were last year and the concern is if the fall wave has just started early there. New Mexico (13) also ranks relatively high when compared to where they were last year. The rest of the states in the region are Montana (25), Colorado (31), Utah (37) and Idaho (47). Cases are actually flat in Colorado and Utah and increasing in the other states. Idaho is a bit of anomaly. They saw an increase last year in June that the rest of the region didn’t and they were coming off that peak in mid August. This year, cases are still going up. But Wyoming is the most problematic in the region.
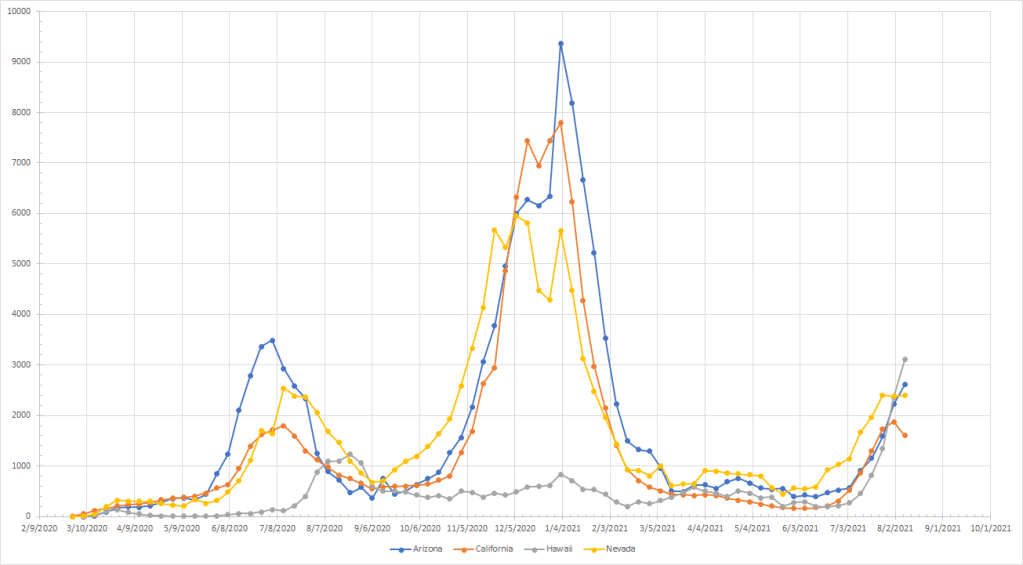
Now we get the two desert states and California and Hawaii. At this time last year, Hawaii had not yet peaked while the other three were coming down from the June/July peaks. This year, California and Nevada appear to have peaked while cases are still going up in Arizona and Hawaii. Because of the delayed peak, Arizona (23) ranks in the top half of states when compared to last year at this time but they have not yet passed their peak from last year. Hawaii (24) also ranks in the top half of states but they are at an all time high for cases per million. So it is not just the Southeast where we are seeing bigger waves. California (43) and Nevada (45) are still above where they were last year but not as far above as most of the rest of the country.
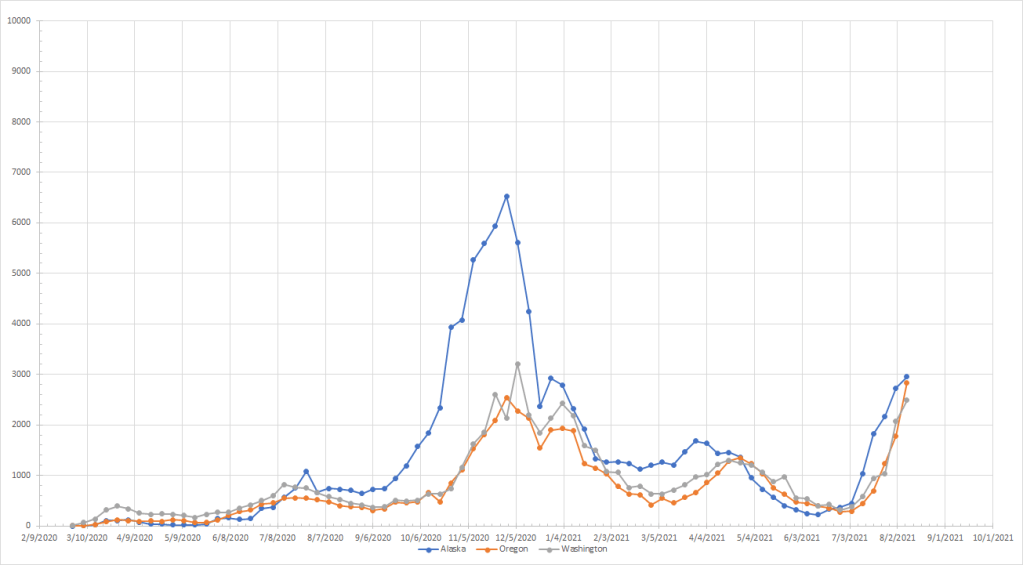
Lastly, the Pacific Northwest including Alaska. All three states have been seeing increases since early July compared to last year when all three were flat. They all saw waves in the fall/winter with Alaska starting before the other two. Oregon (7) ranks very high in terms of the increase in cases year over year and also sit at an all time high for cases per million. Both Washington (11) and Alaska (14) rank in the top 15. Washington is close to an all time high while Alaska has a long way to go. This region and the Northeast are probably the most dissimilar to where they were last year at this time.
The virus certainly seems capable of making new patterns although past history here and in other places suggest that it takes several weeks to come down from a peak. And waves tend to last 8-10 weeks. This would mean that places like the Pacific Northwest and the Northeast will see peaks in September. Does that mean they’ll be declining in October and potentially November when we’d expect to see things going up? Or does it mean that we’ll get a short decline followed by a larger peak in the late fall/winter like we had last year? That’s what is unusual about the patterns we see in those places and I’m not going to hazard a guess at this time.
But it does seem like the states people love to hate have peaked and we’ll see cases start to drop there. Maybe then, someone will notice Hawaii and Oregon.
