

I’m going to skip the state graphs this time. Everything is still going down. If you buy into seasonality as the main factor, we should expect to see cases continue to drop for a few more weeks and then we’ll have to see if the Sun Belt acts up again.
For the week that ended yesterday, there were 7.3 million new tests recorded. This is down 8% from the week before and is the lowest since the week that ended on October 3rd, 2020. Back then, cases had started to climb in a few places so testing had started to ramp up but it wasn’t yet noticeable in case counts. For reference, back in August of 2020, we were averaging about 5.7 million tests a week.
There were 186,811 new positive cases recorded last week. This was down almost 23% from the week before and represents the fifth straight week of large declines. This is the lowest number of newly recorded positives in a week since the week ending on June 20th, 2020. In that week, there were only 3.8 million tests recorded. My opinion remains that we are still testing at a higher level than necessary given what appears to be a low prevalence.
When you combine the two numbers above, 2.6% of the tests recorded last week were positive. This is the fifth week in a row that has dropped. Back during the week that ended on March 13 of 2021, we dropped to 3.5% positives which was an historic low. The last three weeks have fallen below that with each week setting a new low for this pandemic.
There were 3997 new deaths recorded last week which is the lowest number since the week that ended on July 4th of 2020. The number of newly recorded deaths has not been above 1000 since April 8th. For contrast, towards the end of the wave, it was not uncommon to see more than 4000 newly reported deaths each day.
Which is just a whole bunch of numbers that say the situation continues to improve and we are certainly in the best place we’ve been since this whole thing started. How long does this go on? If you go back to last year, cases bottomed out between May 24th and June 13th and then started back up again mostly in the Sun Belt states. Not sure what is going to happen this year so we’ll wait and see if things kick back up again. Would not expect to see anything like we did last summer but you never know.
We’ll just end with two charts. This one shows number of new cases per day since March 21st. This was more useful a few weeks ago as we could compare day by day and start to see that things had peaked. Now, it is just obvious that the last two weeks are so much lower.
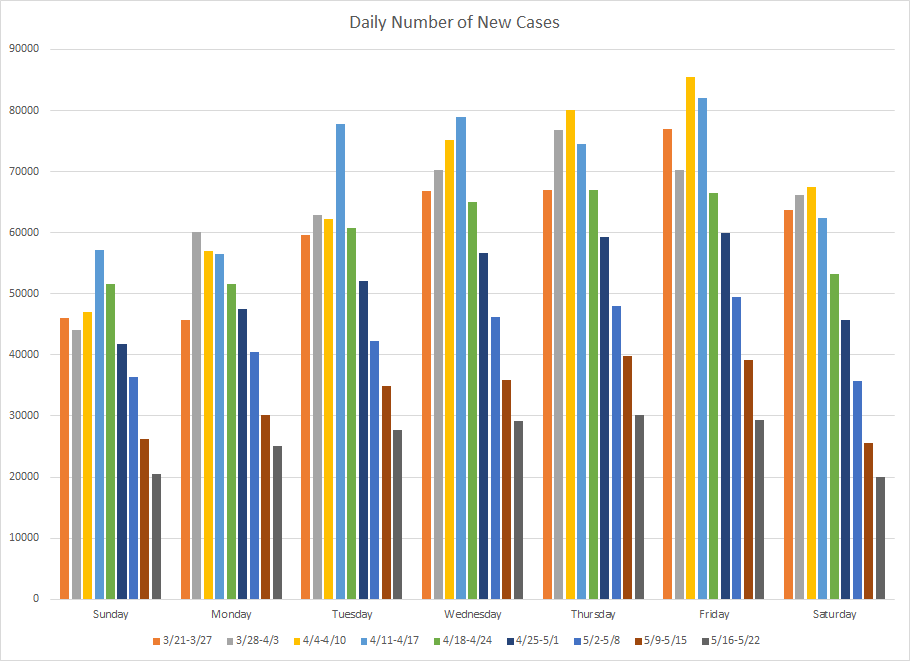
So I took the data and did it in a slightly different way. Instead of using days on the x-axis, I’m using the calendar week and then using bars for each day. Its a little better at showing visually how this week compares to previous weeks. And the downward trend is much more obvious here even with the day to day variations.

So that’s where we stand. Last week was into historic low territory and this week was even lower. It will be interesting to see if it can fall much lower.
