

Well, I think the above goes a bit too far. It certainly is true that cases continue to drop and the situation is significantly better than it was in the fall and winter. Everyone is going to have their own comfort level around things like masks but unless there is a major upswing in cases, the momentum to remove all restrictions is going to continue to grow.
It also makes posts like these kind of boring but I think there is still some value in providing the numbers and the trends. So let’s get to it.
For the week ending yesterday, there were 7.9 million new tests recorded. This is down significantly from the last two weeks and the lowest total since the week ending on October 10th. I would hope this continues to drop as cases drop. As we get fewer cases, then there will also be fewer people coming into contact with positives and both should drive down testing.
The number of newly reported positive results was 241,335 which is down 20% from last week and the fourth week in a row with big declines. We are now down more than 50% from the mini peak in mid April and down 86% from the peak in early January. This number is the lowest number of positives in a week since the week ending on September 12th which was right before the fall wave started in several states.
The percentage of tests that were positive was 3% which is down from last weeks very low 3.3% and is the third week in a row we’ve been under 4%. The 3% is the lowest for any week since things got started in late March.
The number of newly reported deaths last week was 4,275 which is the 11th week in a row it has been lower. This figure is the lowest since the week ending on June 27th which was right at the beginning of the Sun Belt wave. Of interest is that about 10% of the deaths are from Michigan which saw the biggest April rise in cases.
On a state level, cases went up in just three states last week. Alabama which wasn’t a real rise but just a clearing of some old data and Mississippi and Nevada but neither of those increases look to signal a new trend. In other words, cases are down across the board. Nothing but good news.
Since I made the graphs, I might as well show them. It will reinforce just how much things have improved in just the last couple of weeks.

It bears repeating that cases are related to testing volume and we didn’t have the testing volume in the spring that we did in the fall. Others have tried to adjust for testing volume but I’m just reporting raw numbers. The reality is that the actual numbers back in April of last year are significantly higher than what you’ll see on the graph. Anyway, the Northeast saw the brunt of cases last year and then things were quiet until October when the fall/winter wave hit. Most (probably all) saw a mini rise in March/April but all are now headed down.
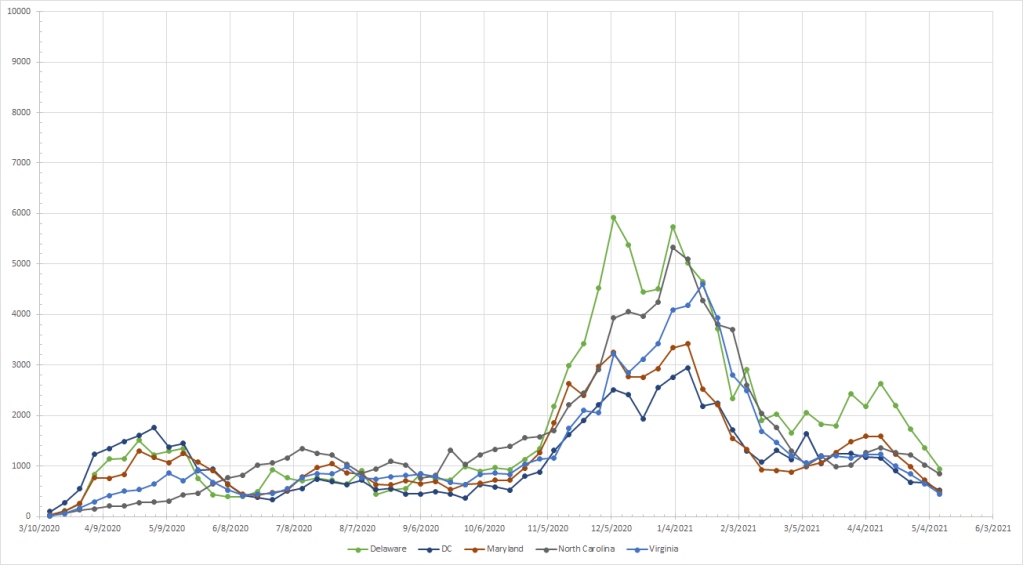
These divisions are based on latitude and longitude but states don’t fit perfectly into those boxes. The Northern part of this region was impacted in the spring while North Carolina and Virginia didn’t see big spikes. Cases took off here in early November and peaked at the end of the year. (The disruption over the last two weeks of the year creates a double peak in places). Delaware did not drop as much as the rest and bounced up a bit in April but all are now going down.
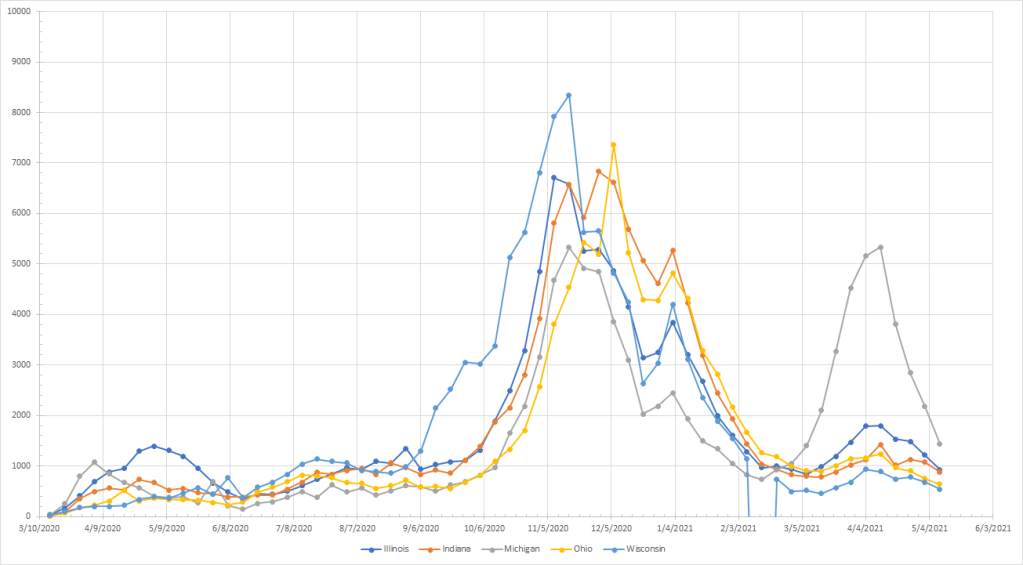
In the Midwest, Michigan did see a hit in early April and Illinois had one in late April. Wisconsin started the fall wave earlier than the rest but by mid October, cases were going up everywhere. The peaks are a little different with some peaking in mid November and Ohio didn’t peak until early December. After we got through the holidays, cases dropped everywhere into early March. Michigan had the very unusual wave that peaked in mid April and there were smaller rises in Illinois and Indiana. But Michigan has been dropping although it is still not at the levels of others which also continue to fall.
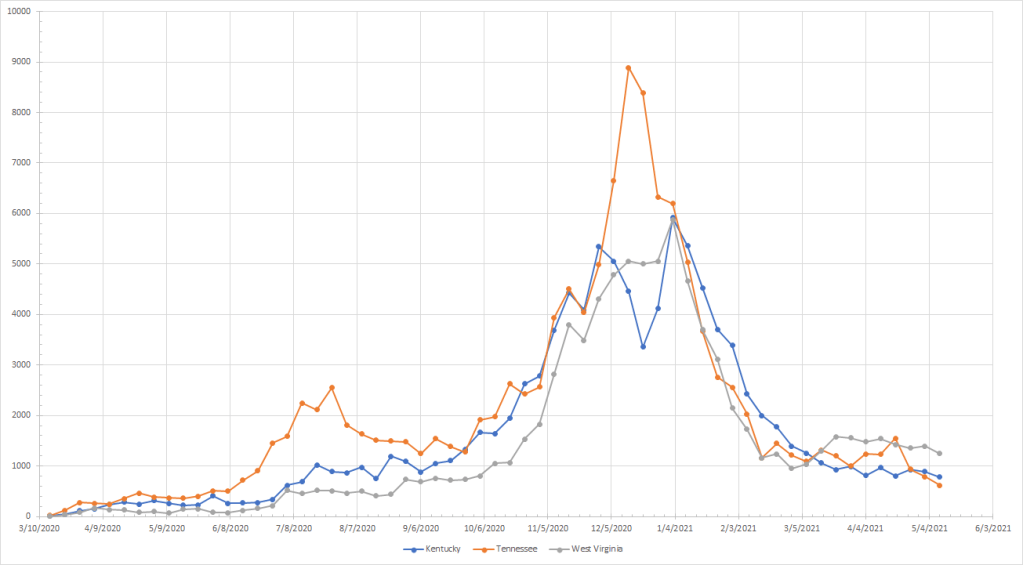
This region was basically untouched early in the pandemic. Tennessee did see the rise in the summer like the rest of the Sun Belt while the other two saw cases go up but not as much. All three states saw cases start to rise in October and they all peaked by the end of the year (Tennessee was a bit earlier than the other two). West Virginia saw a small increase in March and cases have dropping slower there than in Kentucky or Tennessee but all are coming down.
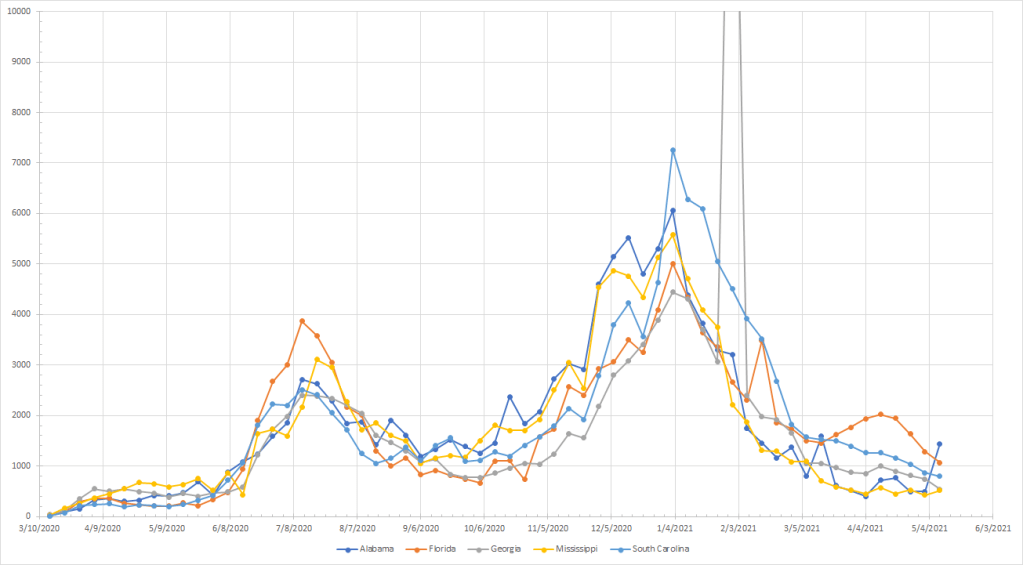
The Southeast was also not impacted at the start. All five states in this group were part of the Sun Belt wave with cases rising in early June and peaking in early to mid July. Cases started going up again in October although the biggest rise was in November. All peaked by the first week in January and have been dropping since (as previously mentioned, the Alabama numbers for last week are an anomaly). Florida did see a small increase in March but has now dropped below the previous lows back in March.
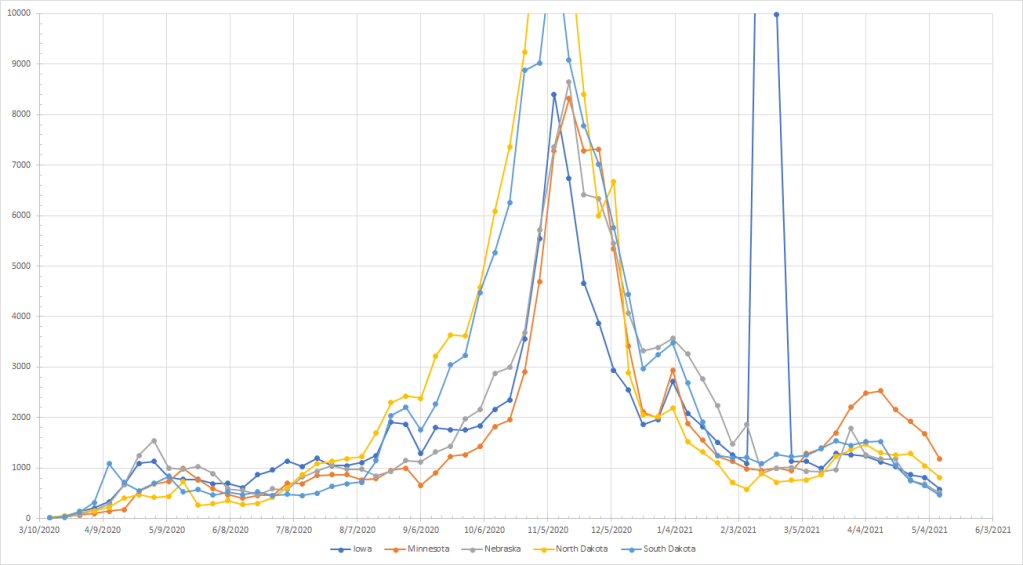
In the Upper Midwest, you had a few states see a spike in cases in April but the region wasn’t really touched until August when things started to climb in the Dakotas. By September, cases were rising everywhere in the region. By mid November, cases had peaked everywhere and the declines were pretty sharp. In March, Minnesota saw a short rise in cases which peaked in mid April and they are still above the rest of the states in the region, but cases continue to drop everywhere.

Louisiana had an early spike because Mardi Gras was happening just as the pandemic was getting started here. To some extent, all states saw a rise in the summer although Texas, Louisiana and Arkansas saw the biggest rises. Things were gradually increasing in the early fall but took off in mid to late October. The peaks were mostly in December although Kansas looks to have peaked in early November. The Missouri spikes in February and March are anomalies. No state saw a rise in April and cases have continued to go down everywhere in this region.
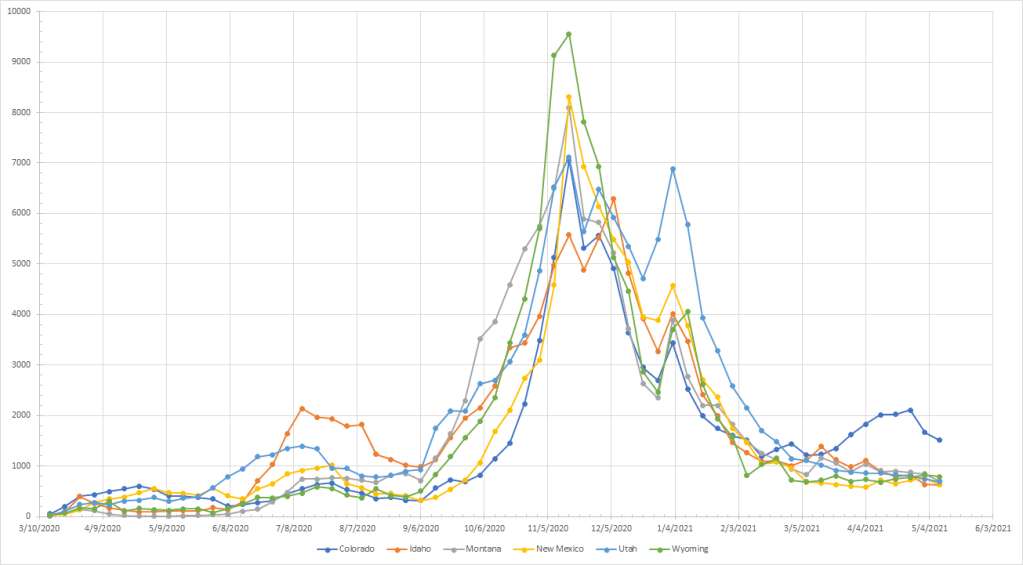
The region was mostly untouched at the start. There were increases during the summer in Utah and Idaho which don’t really fit the Sun Belt pattern. Cases everywhere started to go up in early September and continued to rise until most places peaked by mid November. Utah had a second peak in the first week in January and cases in all states but Colorado have dropped since then. Cases in Colorado went up gradually until late April where they peaked and have started to come down but are still above the rest of the states in this region.
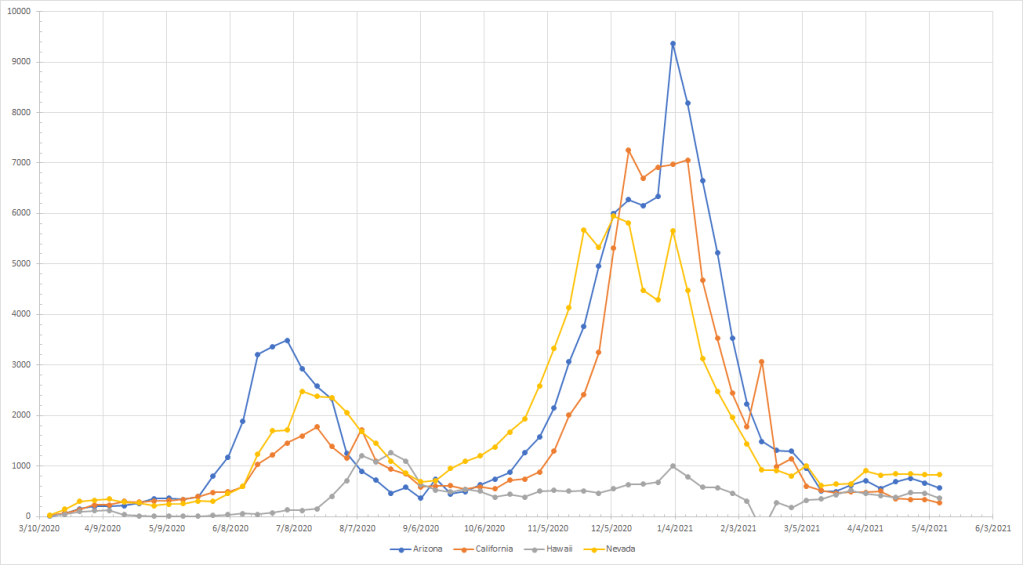
Again, not a lot was going on here at the start but cases in Arizona, California and Nevada all started going by June. Arizona was first and had the highest peak during the summer wave in this group. Nevada started the fall peak in early September and the other two had joined in by November. All three peaked by the end of the year and cases have steadily dropped since then and are now basically flat. Hawaii has always been different and didn’t really see any cases until July when it hit a peak it hasn’t yet gone above.
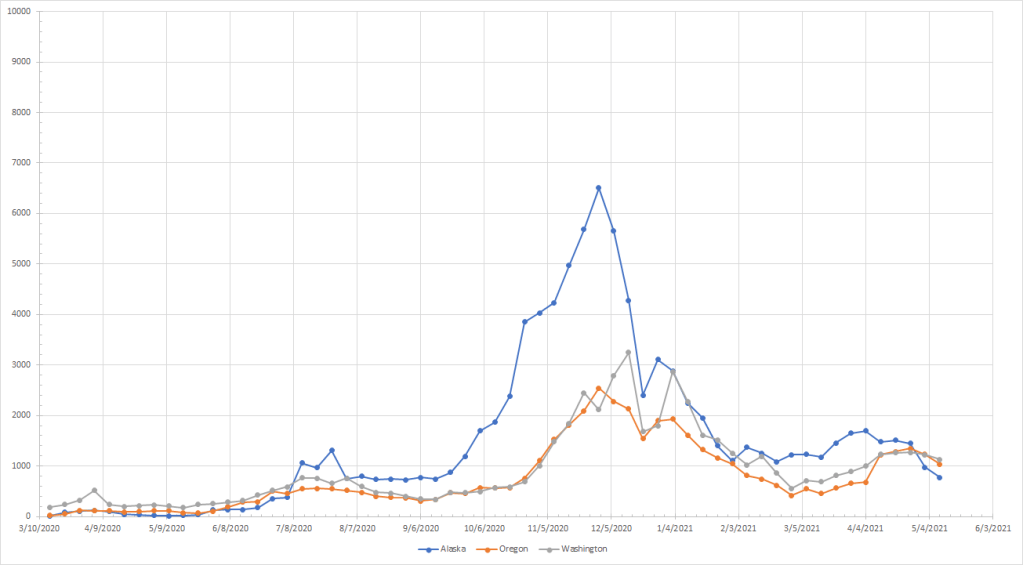
Washington was impacted at the start of the pandemic and Alaska saw a rise in July but things really didn’t get going here until early October when cases started rising in Alaska. Oregon and Washington didn’t really see things start to ramp up until November. Alaska had peaked in late November. Oregon did as well but things didn’t really start dropping there until December only to rise again in April although they now looked to have peaked. In Washington, cases peaked in early December and they also saw a small rise in April which also appears to have peaked.
With some notable exceptions, states in a given region have similar curves in terms of the timing of when things start to rise and when they peak. Given that we did have differences in how each state responded, you could argue that seasonal and geometric patterns were far more important than any of the counter measures adopted by the various states.
But the situation continues to improve. I’m not yet saying it is over but it may be a very quiet summer.
