

In some ways, this pandemic has sort of divided us into camps. There are those who watch the news and the government reports and take all information at face value and never seem to raise serious questions. Then, there have been those who have sought out their own information and tried to draw their own conclusions.
There are a couple of sources that have been trying to call attention to how well our trend in cases fits with previously developed seasonality models of respiratory illnesses. Past history suggests that things will start to drop off as we get through April and last week certainly trended in that direction.
So let me just finish off the bar chart I started last week now that we have complete data from last week. Saturday’s numbers were well below the previous four weeks continuing the trend we had been seeing where the numbers were starting to look like the week of March 14th before we saw the little rise in April.

To put some actual numbers around this, for the week ending on the 24th, there were 10.5 million new tests recorded. This is actually a little higher than we’ve been but consistent with where we’ve been since February. Of those, there were 419,995 new positives reported which is down 16% from the week before and the lowest number of new positives since the week ending on March 13th. Overall, 4% of the tests recorded last week were positive which is also the lowest figure since the week ending on March 13th.
Cases continued to drop in the former hot spot of Michigan and also dropped last week in Maine which likely ends their upward trend. On my list of “problematic” states, only Oregon, Washington and Colorado saw an increase in cases last week and all three were small increases. It seems all three are close to peak and I don’t see any place showing the type of growth we saw in Michigan or Maine. Pretty much everything has turned down.
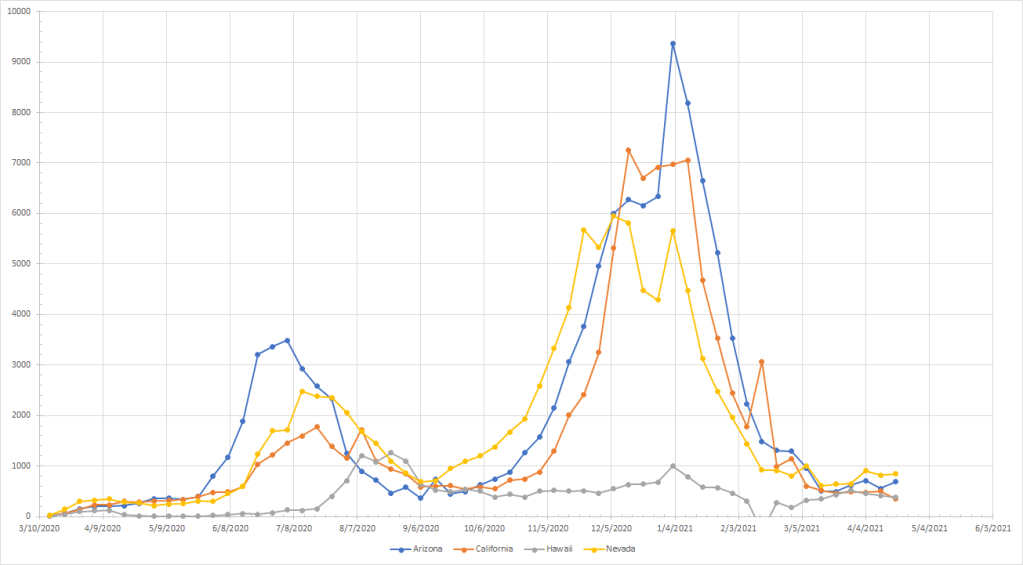
Because of the gaps in weekend reporting, I went back to construct new graphs with the week running from Sunday to Saturday. I decided to calculate cases per million people so we can put all the states on equal footing and, with that, reconstructed my graphs by US region. The more data I see, the more I become convinced that the patterns are regional and seasonal and this helps illustrate that.
I did go back to when I started compiling data so we do have graphs going back a year. It does create some issues because that compilation switched sources a few times and so you’ll see odd blips where that happens. Plus, there are states that have made massive corrections (see Missouri) either adding batches of old tests or correcting old counts and that creates more random spikes but I think the overall patterns still come through.
Last bit of explanation – I capped the graphs at 10000 cases per million so you’ll see a couple of cases where the graphs go above the top line. But I did this to keep all the graphs on the same scale and to improve readability.
Anyway, we start in the Northeast. This is where most of the problematic states were and the general pattern was increasing cases through mid March to mid April. States started turning down at various points and cases were down last week in all states in the region. Maine gets lost in the muddle at the end but it turned down ending the sharp rise we had been seeing. Unless there is a specific disruption (like end of the year), we don’t typically see things start back up again right away after a sharp downward break. Would expect everything here to continue to drop as we move into summer.

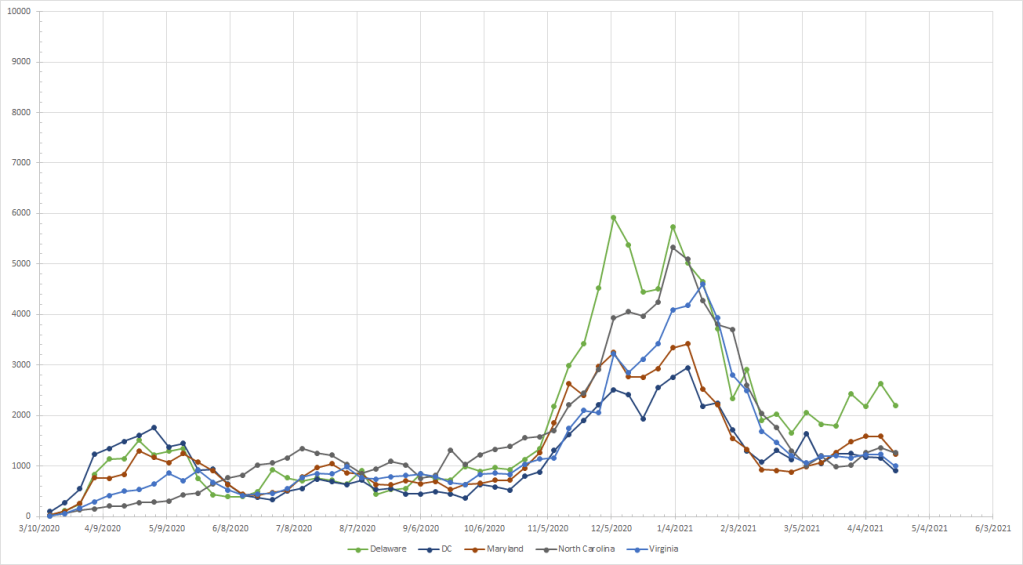
In this next group, cases were going up in both Delaware and Maryland although the increase in Maryland was a slow rise and not exponential type growth. Both dropped last week. Delaware has been in a up/down pattern for a couple of weeks but the general trend is still up so I’m not sure yet if things are over there. Maryland really broke the pattern and I’d expect cases will continue to drop there. The other three states in this group have been flat since they hit bottoms after the winter spike.
In the Midwest, we had been seeing cases rising everywhere although none of the other states were seeing the type of rise observed in Michigan. Note how dramatic the drop was in Michigan and things have turned down in all of the other states as well. I know it is only one week and I don’t like making projections based off a single week but the size of the decline suggests we’ve seen the worst and that things should continue to drop.

These next three states are kind of boring. Cases were up in Tennessee but I don’t think that’s a real issue. They’ve all been flat through April so no issues here.

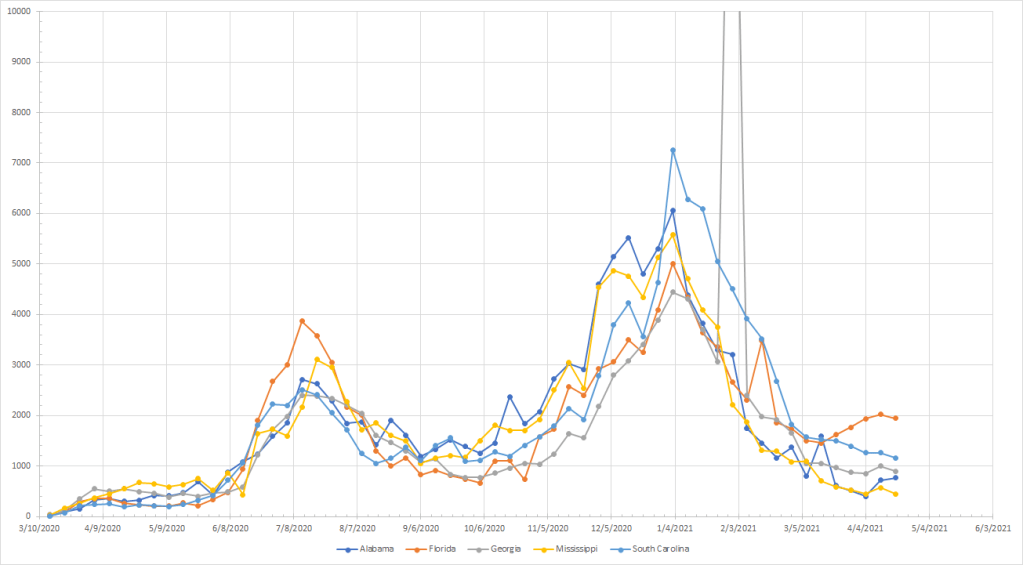
Into the Southeast where Florida was really the only state with some concern as cases were slowly rising there throughout April. They did drop last week so we’ll wait and see if the pattern continues. The others are just really bouncing around a bottom. South Carolina hasn’t yet hit a bottom and cases continue to fall there. No real concerns here.
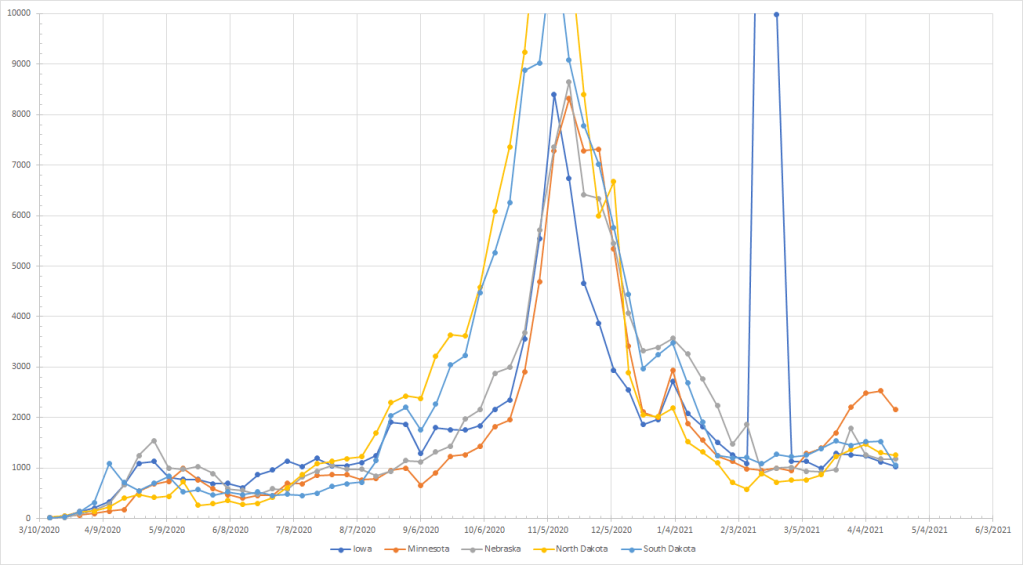
To the upper Midwest where Minnesota was looking like a problem but growth slowed two weeks and then cases dropped last week. The spike in Iowa is like Georgia in the graph above – an artifact of the change in sources. Other than Minnesota, no real increase was observed anywhere and the other states have been flat through March and April. Now that Minnesota has turned down, there aren’t any problems here.
Other than random spike in Missouri as they made changes to the case counts, everything here has been down or flat through March and April. No issues here at all.

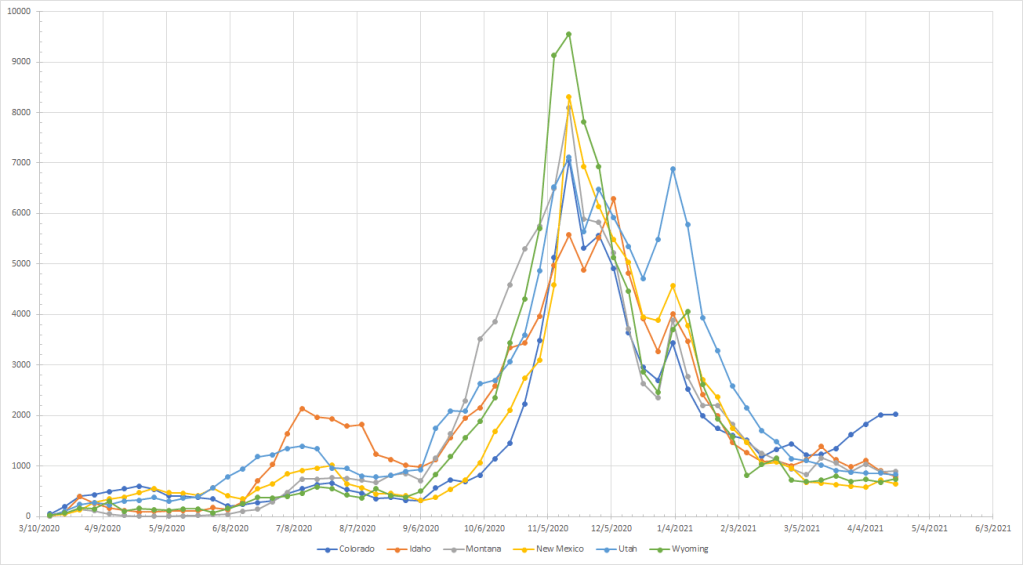
In the Rockies, Colorado stands out. Cases were up again last week but by a very small margin which could indicate a top. Will watch and see. All of the other states here have been declining or flat through March and April.
I did split the West up so this is the Southwest and Hawaii. Well California is so big it crosses lots of regions but I have to put it somewhere. All four states here have been flat through March and April and there are no issues here at all.
Now we have the Pacific Northwest which includes Alaska. Alaska did see cases rise in late March/early April but they have leveled off since then. Oregon didn’t look like a big problem until we saw the big jump last week while Washington has been steadily but slowly increasing through March and April. Oregon didn’t continue to see the big increase and Washington was just barely up so we’ll watch and see but neither one really looks like a big problem right now.

So in a few states we still have cases slowly rising but in most places cases are falling or are at a minimum. Last week was a big change as it broke the rising trend we had been seeing. Now we need to see if it is really just seasonality and, if so, we’d expect things to continue to trend in the right direction.
