

Before we start, I need to acknowledge that several states did not report any new numbers yesterday. Some of this is expected. Connecticut, Idaho and Louisiana have stopped reporting on weekends so they usually have a big number on Monday. But it means my weekly totals for those states are a fair comparison.
But I have no Saturday numbers from Alaska, Nevada, New Mexico, North Carolina, Oklahoma, Rhode Island, Tennessee or Wyoming. Just means my total for last week isn’t quite a fair comparison to previous weeks but, given the expected numbers in those states, it is probably low by around 5000 cases.
For the week ending yesterday, there were 9.9 million tests recorded and that is the third week in a row with similar numbers. There were 490,398 new positives recorded and that is up 3.3% from the 474,597 two weeks ago. The percentage of positive results was 5% and that is also a slight increase from the 4.7% two weeks ago.
In other words, we continue a slow upward trend in the numbers. Newly recorded deaths continue to drop though. Last week, there were 5003 and that is the lowest number since the week of October 11th. Deaths are a lagging indicator but cases have been rising for five weeks in a row so we should have expected to see that start to reflect in the death numbers unless we aren’t getting the same level of serious cases.
Also, as more time has passed, it appears more likely that we aren’t going to see a significant number of states like Michigan. Right now, Maine is the only place that is close and there is some marginal concern about Pennsylvania, Oregon and Washington. Places like Minnesota and Colorado have seen the growth rate slow without ever getting into an exponential phase. Even Michigan slowed down last week and may be nearing a peak.
I’ve got some new graphs to show. These are weekly totals using the regions I’ve used in the past. The downside to these graphs is that states with large populations (California, Texas, Florida) can dominate a region.
The first graph is the Northeast. Earlier in the month, we were seeing increases in many of these places but all but Maine and Pennsylvania have been declining recently. Obviously, Maine gets lost when combined with New York, New Jersey and Pennsylvania but as a region, things have started to improve.

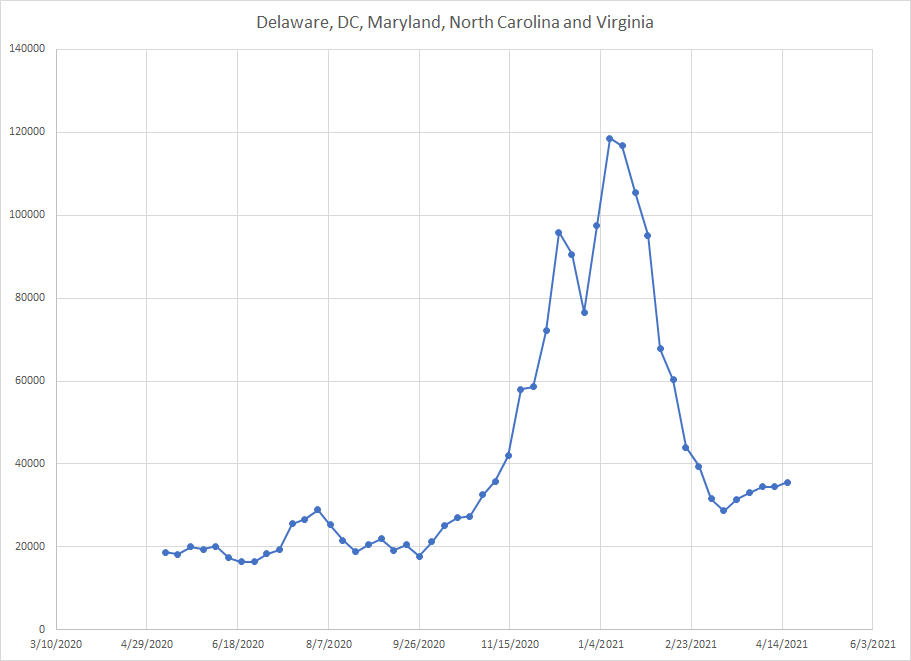
Moving down the east coast we get to this next group. Delaware and Maryland were the most concerning. Both are still showing increases but the rate of change has slowed. In this region, things have been going up for most of the last five weeks but still haven’t gone above late February levels so not a major area of concern.
When I did this regional breakdown, I was going east to west and then north to south so the next group was the industrial Midwest. This includes Michigan which drives the graph but we did see increases in Illinois and smaller increases in Indiana, Ohio and Wisconsin. The curve clearly flattened last week stopping the exponential growth. Typically, when you see this, it is a sign of a top meaning that the worst may be over here. This is going to be the interesting region to watch next week to see if cases start to drop.

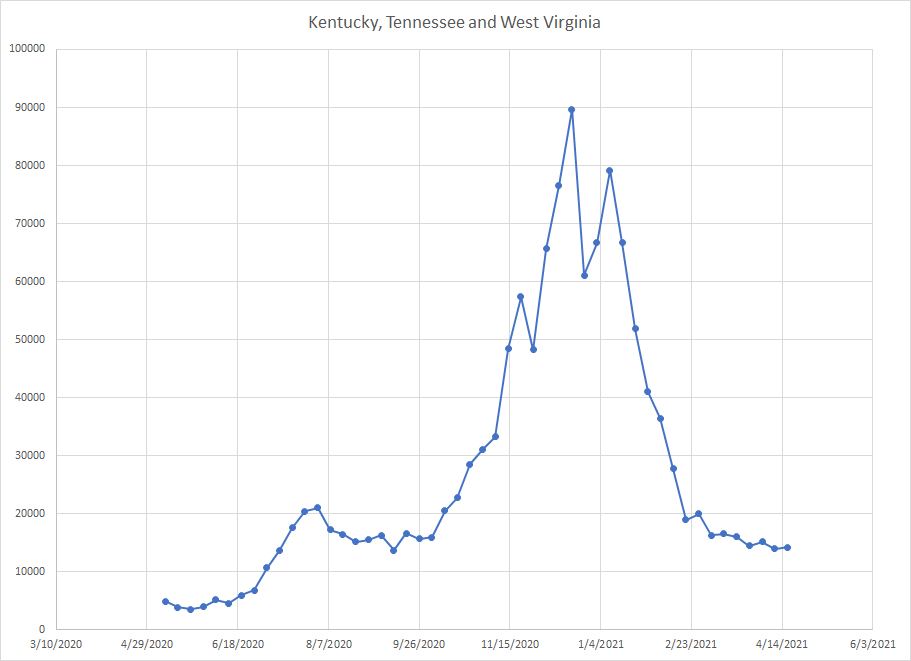
The next group is just three states and none of them have been problematic. Well West Virginia looked that way for a bit but it has been falling recently. As a region, they are just seeing a slow drop over the last six weeks and there is no reason for concern here.
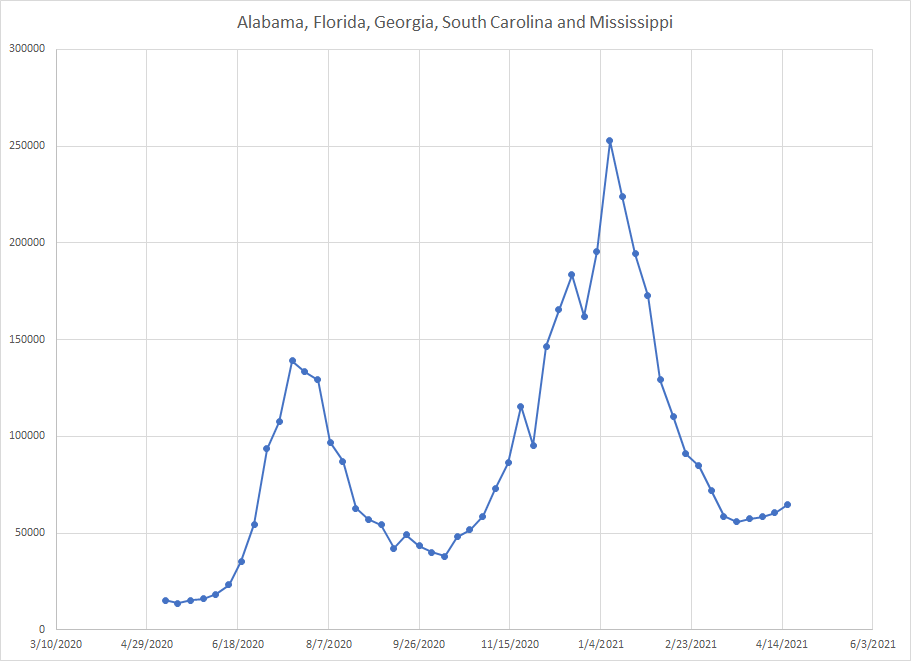
Here is the deep south east of the Mississippi river. Florida has seen cases rising and that drives the increase you see here. Still, even though cases have been going up for several weeks in a row, the rate of increase is small and the numbers are still below late February levels. I suppose you could try to argue that we saw a similar pattern at the beginning of the chart before things took off but given the difference testing levels, I don’t think it is a fair comparison at all. Seems unlikely that we’d see another breakout.
The next region is dominated by Minnesota but we were seeing increases in the Dakotas as well. Minnesota never saw the same rate of growth as Michigan and the increase may have stopped as we see a small dip in the curve. Another wave seems highly unlikely here as well.

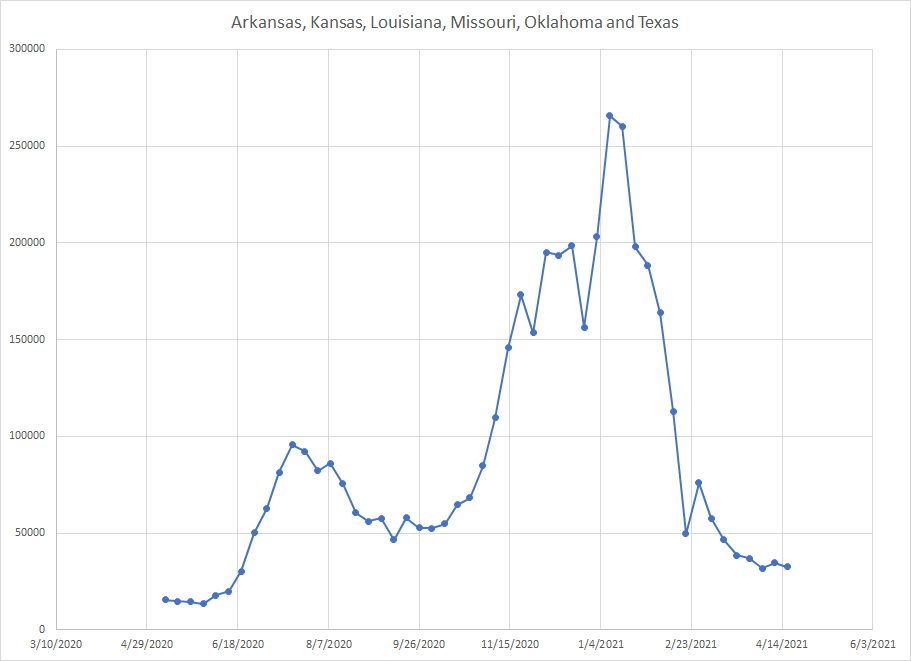
This next region is dominated by Texas but really there isn’t a state here that looks like a problem. As a region, the total was up two weeks ago and then down last week and looks like it has hit a bottom and should stay in this flat region for a bit.
Now we get to the Rockies where only Colorado has been of any concern. While cases are still increasing there, the rate of change is nowhere close to exponential growth so there is little likelihood of them becoming another Michigan. The region as a whole has seen a small increase but has not gone beyond lat February levels. Again, there is just no evidence to suggest that we are suddenly going to see a new wave develop. Then again, things were declining in September right before the last wave started.

Now this is one where state by state graphs would be more useful as California really drives the overall trend and hides what’s going on in other places. Things are still going up in Oregon and Washington and I’ll probably just do some individual graphs in my next post so we don’t end up losing sight of that.

Our collective experience with this type of pandemic is limited. There are those who look for seasonal patterns which have been established for other respiratory illnesses which suggest things should fade as we move into May. The influenza pandemic of 1918 has a first wave in the spring and second and larger wave in the fall and a third smaller wave in the spring of 1919. I’m no expert but there are reasons why pandemics fade and we do have vaccines for this one which give some protection so I do think it will be harder for it to take off like it did in the fall. And it is certainly possible to be wrong but this is feeling more like a peak than the starting point to another run upward.
