

COVID Cases Increase Last Week – First Weekly Increase in Six Weeks!
Half of States See an Increase in COVID Cases!
If I were going to write a scare article on the virus, these two headlines are factually accurate. I could probably add in something like “experts concerned about a potential new wave” because I’m sure I could find an expert or two who would express concern. This is just an illustration that even factually accurate statements can be misleading if you don’t place them in the proper context. The truth is that we continue to see this wave recede. Some of the states that were leading the wave have now reached kind of an equilibrium where cases may just bounce around with no real pattern.
For the week ending on February 27th, there were 10.4 million tests recorded which is up a million from the previous week. In that total, there were 474,791 reported positive results which is up from 464,246 the week before. See, there was an increase! I wasn’t lying! But if I said we saw 10,000 more positives with a million more tests, it hardly seems like the start of a new upward wave. For the week, 4.6% of the tests were positive which is down from 4.9% the week before. For reference, the weekly figure I’ve got is 4.1% so you get an idea of how close we are.
Back in the summer, when testing wasn’t so easy, the average was around 6 million tests a week so we are still far above that. At some point, it is time to scale back on the testing a lot more. Increased testing during an outbreak makes a lot of sense. Keeping that level high while cases are falling does not as false positives become a bigger share of the total. I have no idea but I’m guessing that a lot of places are just testing anyone who comes in with upper respiratory symptoms. Maybe as the weather continues to warm, we’ll just see a natural fall off in testing.
I won’t show the graphs but we continue to see declines in the number of people hospitalized or in an ICU. There are fewer than 50000 people hospitalized and the current total is the lowest since October 30th. We dropped below 10000 people in an ICU yesterday which is the first time we’ve been below 10000 since November 2nd. I won’t be able to track these figures after next week but we are clearly heading back to pre-surge numbers.
Let’s run through the state graphs where you can see some of the increases and put it into context of when things were at the worst. First up is California where the number of new cases reported last week is down 86% from the peak in December. As a reminder, I didn’t start compiling this particular data set until late April so the first wave that hit the east coast (primarily NYC metro area) isn’t really represented here.

Texas is next and they did see cases come up last week. Of course, Texas has all kinds of weather problems two weeks ago and I think I may even have said to expect cases to come back up a bit. Still, they are down 67% from the peak in mid January.

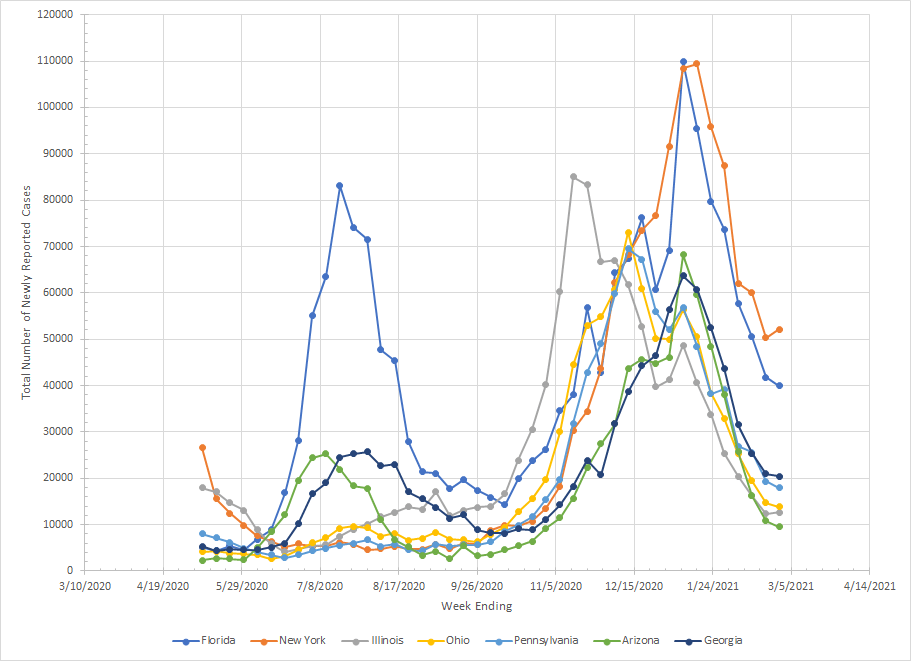
The next set of graphs have several states. It may be hard to really see in some of these graphs since the lines are so close together but I’ll give you where they were last week relative to peak so you can see that even if things increased a bit last week, it is still nowhere near where we were at the height of the outbreak.
- Florida – down 64% from peak.
- New York – down 52% from peak.
- Illinois – down 85% from peak.
- Ohio – down 81% from peak.
- Pennsylvania – down 74% from peak.
- Arizona – down 86% from peak.
- Georgia – down 68% from peak.
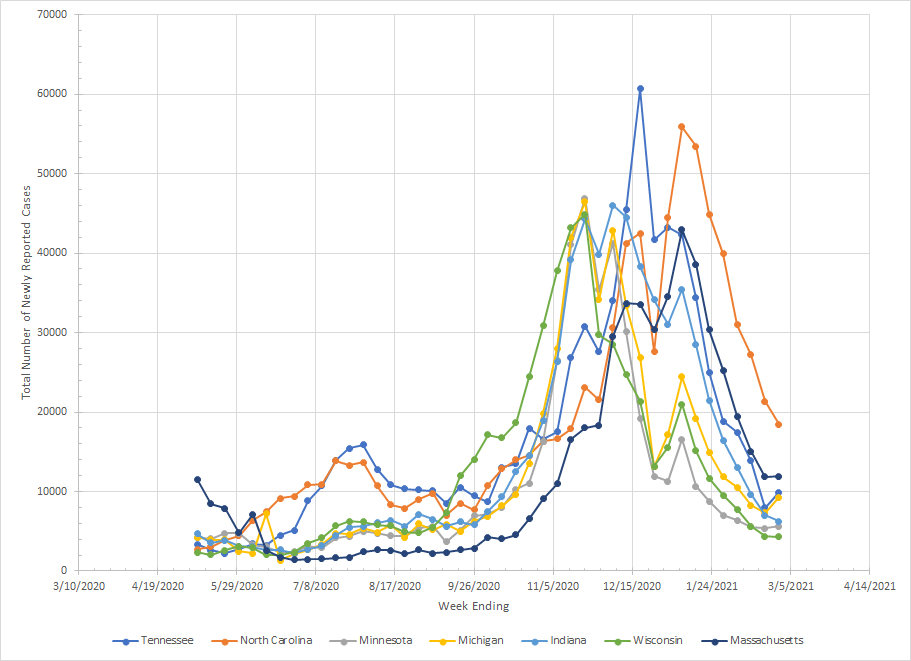
Moving on to the next graph.
- Tennessee – down 84% from peak.
- North Carolina – down 67% from peak.
- Minnesota – down 88% from peak.
- Michigan – down 80% from peak.
- Indiana – down 86% from peak.
- Wisconsin – down 90% from peak.
- Massachusetts – down 72% from peak.
On to the next set of states.
- New Jersey – down 47% from peak.
- Virginia – down 68% from peak.
- Colorado – down 78% from peak.
- Missouri – down 88% from peak.
- South Carolina – down 57% from peak.
- Iowa – down 87% from peak.
- Alabama – down 78% from peak.

Moving on:
- Oklahoma – down 80% from peak.
- Kentucky – down 70% from peak.
- Louisiana – down 76% from peak.
- Washington – down 74% from peak.
- Utah – down 79% from peak.
- Maryland – down 73% from peak.
- Arkansas – down 80% from peak.

And the next group:
- Kansas – down 88% from peak.
- Connecticut – down 64% from peak.
- Nevada – down 85% from peak.
- Mississippi – down 77% from peak.
- New Mexico – down 85% from peak.
- Nebraska – down 88% from peak.
- Idaho – down 82% from peak.

Almost to the end:
- Oregon – down 76% from peak.
- West Virginia – down 79% from peak.
- South Dakota – down 89% from peak.
- North Dakota – down 94% from peak.
- Montana – down 86% from peak.
- Rhode Island – down 73% from peak.
- New Hampshire – down 67% from peak.

And the last group:
- DC – down 56% from peak.
- Wyoming – down 88% from peak.
- Alaska – down 83% from peak.
- Maine – down 73% from peak.
- Delaware – down 66% from peak.
- Hawaii – down 78% from peak.
- Vermont – down 34% from peak.
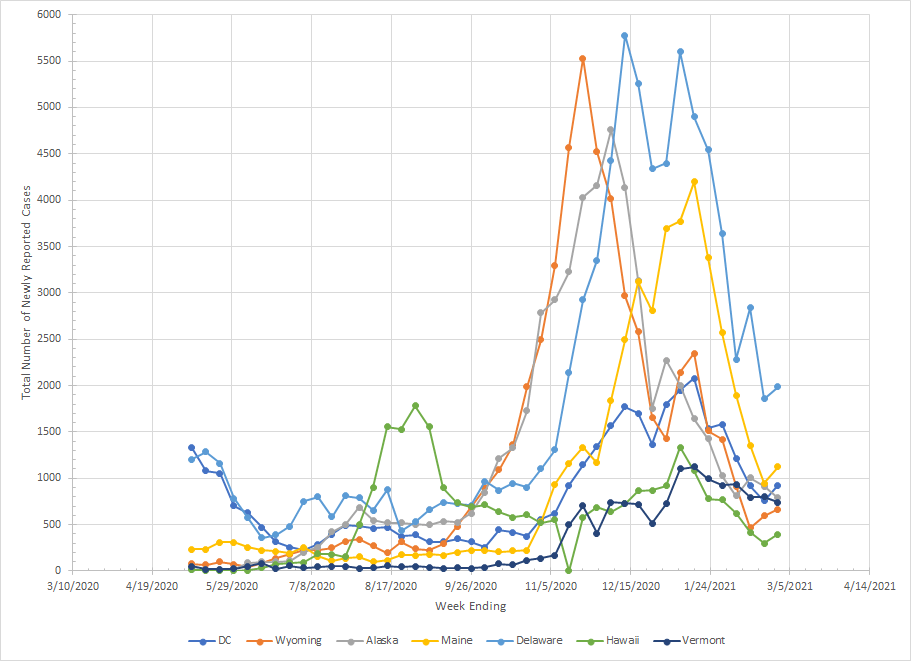
Vermont and New Jersey are the only states that are not down by more than 50% from their peak. Vermont is an odd case I’ve mentioned before as they never really had the type of exponential growth we’ve seen elsewhere so they never reached a really high peak.
If you look at most of the states, they are still way above where they were last summer but getting back to those levels will depend on testing. I don’t show percentage of positive results on these graphs but there are states that are back to levels from the summer but they are still testing at a much higher rate so they are getting more cases. As a simple example, 4% of 100 is 4 and 4% of 200 is 8. Same underlying rate but double the testing means double the cases.
What we want to see is to get to a point where the curve is essentially flat and that will take a bit longer for most places. Look back at the Dakotas which seem to be the farthest along on the decline and you get an idea of what I’m talking about as the last four or so points are flat. As we go through March and add data, it will become a little more obvious than it is now.
It is certainly possible for things to start back up again. Right now, that isn’t happening and we continue to be seeing the end of the wave.
