

I’m going to have to temper my enthusiasm since there are still a few voices suggesting we are going to see new surges caused by the variant versions of the virus. But we saw some big drops from last week to this week. Almost every state is down. If we don’t see an upturn, I wonder how long it will take before the last of the doom and gloom experts admits that things are improving.
One of the things I do with all my calculations is project the number of positive results. This is the only prediction I make and I do very short time periods – one day and one week. While the numbers are usually close, over the last several days, I’ve noticed that the vast majority of both projections are high. Since I base this on average number of positive results over the previous ten days, this is just further evidence that we continue to see things drop. That will likely be the most sensitive indicator if the current trends reverse themselves.
Anyway, for the week that ended on Saturday, there were 11.6 million tests recorded which is still much higher than the summer but down from November/December. There were only 843,123 positive results which is the first time we’ve been below 1 million since the week of November 1. For the week, 7.3% of the tests were positive which is the lowest since the week of October 25th. Clearly, we are going down the mountain and hopefully back to early fall levels.
The number of people hospitalized with a positive COVID result started dropping on January 13th and has dropped each day since then. Here’s a graph to show this visually. The rate of decrease is much sharper than it was during the first two waves.

I want to show both number and percentage of positives. For the percentage, I’ve got my graphs. I’m using the more conservative ones which sum data for a four period so the last data point represents the total percentage of positive results for the period from January 11th to February 7th. As always, my data are taken from the Covid tracking project.
What I also going to show are tables showing the total number of positive results for this week, last week, the week of January 11th (four weeks ago) and the peak for each state. In some cases, the peak was the week of January 11th so you’ll see the same number. Then, I’ve got the percentage change from this week to each of the other time points. I didn’t try to pretty up the formatting so they’ll look a little bland.
But we start, as always, in the Northeast. The lines for Pennsylvania are going to look different from previous graphs. At some point, they updated their data base with a significant number of negative results and that drove the percentages down.
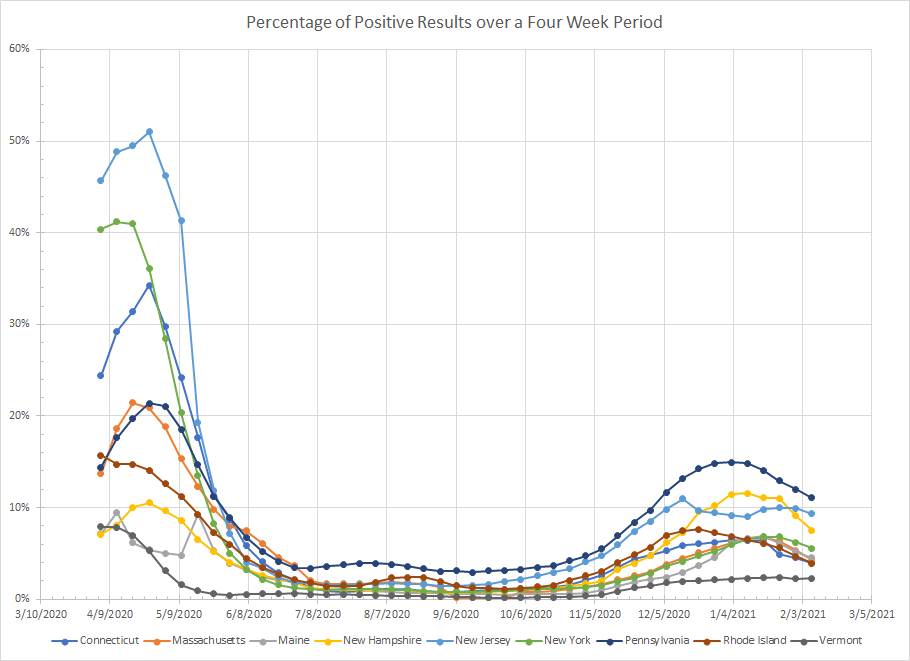

Vermont is the exception here as positive results have not dropped like they have in the other states although the percentage is much lower than the other states. Rhode Island needs a caveat because they don’t report Saturday and Sunday numbers until several days later so the current number will go higher. Positive results are down about 20% from last week in most places and down more than 40% from four weeks ago.


North Carolina is another exception. Cases were barely down from last week. North Carolina also has never really had the type of exponential growth we’ve seen in other places. The other states here were hit in the spring and, with the exception of Virginia, really didn’t come close to seeing the same type of spike. Still, all but North Carolina are down about 25% from last week and 40-50% from four weeks ago.

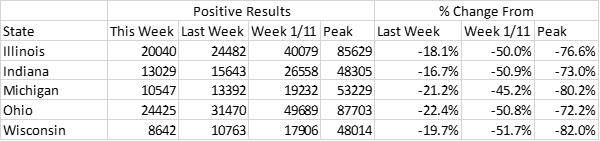
Here’s a region that was hit hard this fall. Wisconsin was first and Ohio lagged a bit but they are all down now. All were above 10% positives at some point in the fall and all but Ohio are now below. Even though things have been dropping here for several weeks, they all saw about a 20% drop from last week. They are also all down about 50% from four weeks ago and 70-80% from peak. They still have more to drop to get back to the flat levels of the summer/early fall so it is good to see that we are still seeing significant week to week drops.
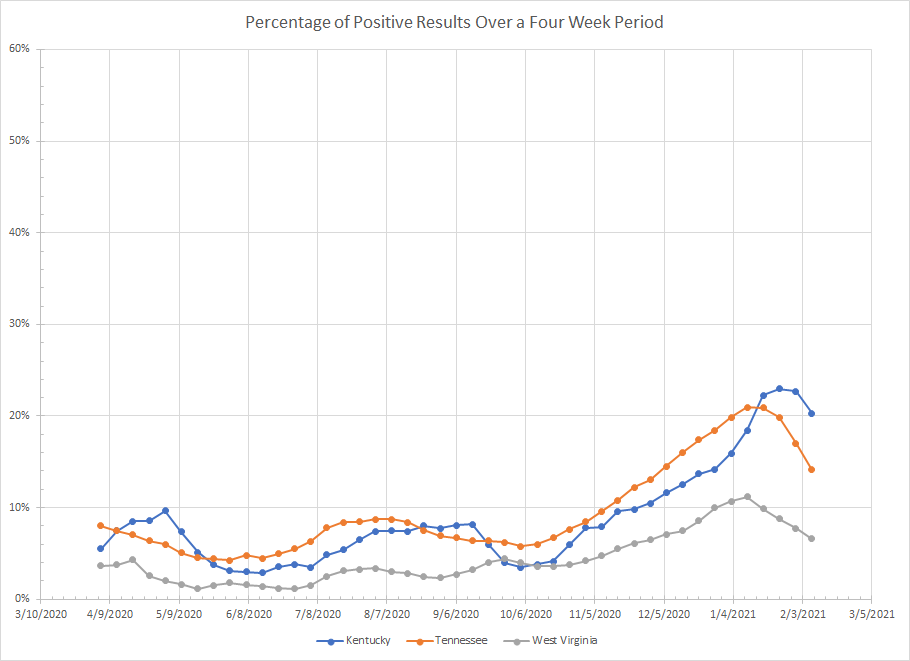

In this region, things were stable until October when all three saw a rise in positives and all three peaked sometime in January. Kentucky was behind the other two and the drops from this week to previous weeks is smaller there than in the other two states. Tennessee is down quite a bit from peak but is still above the levels before the surge started there.


All of these states saw a rise in the summer and again this winter. South Carolina is bringing up the rear with the smallest percentage drops although they never got as high as other states in the region with the exception of Florida. All of them peaked in early January and they are down since then. They are all off more than 30% from four weeks ago. Florida has dropped below 10% positives over the last four weeks.

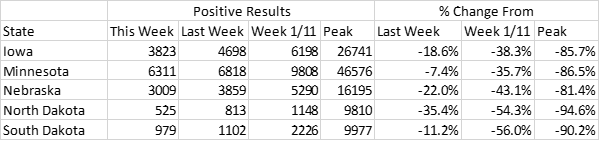
Another region that was hit hard in the late fall with cases peaking back in November and falling since then. I can’t explain Iowa or South Dakota but the other three are below 10% positives and the percentage is falling in all states. Like the Midwest, we still see drops from last week so we haven’t reached a bottom yet. But all of these places are down more than 80% from the peak number of positives with North Dakota down almost 95%. The numbers for North Dakota this last week are very much like the summer.


We’ve got two exceptions in this region. Both Arkansas and Texas actually saw small increases in positive results from last week. But both are down more than 20% from four weeks ago. Arkansas saw a small run up in the summer but not like other states in the south so this fall/winter was the first time we really saw things go up there and, maybe like Kentucky, it will be a slower decline. Missouri is in the best shape here – off more than 75% from peak. I’ve mentioned issues with Kansas before. Oklahoma is a little behind Louisiana but both are clearly moving down.


The Rockies were another region where we saw big spikes in the fall and now all but Utah are down 75% or more from the peak. In the graph, you can see Utah was flat for several weeks and now has started to drop. They are down more than 50% from the week of January 11th so things are finally moving in the right direction. Colorado, Montana, New Mexico and Wyoming are now below 10% positives when all were above during the peak. The decline in Colorado has been a little slower than some of the other states and they didn’t see a big drop from last week but they are still down significantly from peak and from the week of January 11th.


In this region, Oregon and Hawaii really never saw cases go exponential but they did see them increase and they are both down from four weeks ago and peak but down by less than the other states here. Alaska is most similar to other northern states and down 86% from peak. A couple of weeks ago, it was hard to call peaks in some of these places but with the exceptions of Oregon and Hawaii, they are all down more than 20% from last week and many are down more than 50% from four weeks ago. You can also see that California and Washington are below 10% positives while Arizona and Nevada are trending in that direction.
It is hard to not get overly optimistic about these numbers and I don’t want to do that because when you start believing it is over is when something spikes again. But I did want to try to illustrate the drop from last week to this week which was larger than I expected and across almost every state. Most states do have a long way to go to get back to the flat lines of summer and early fall so we have to wait and see if this week was artificially lower for some reason or if we are seeing things drop at a fairly rapid rate.
