

Continuing the year end summary of where we stand with the virus, this is part 2. I’m not going to repeat the caveats from the first post. If you are interested, you’ve already read them. If not, repeating them will just take up space.
Let’s get right the graphs. Going to cover the south in this post. It is not quite in alphabetical order because I’m keeping with the groupings I’ve used before. One exception – I’m moving Kansas to be covered when I get to the Midwest. So we’ll start with the border states.
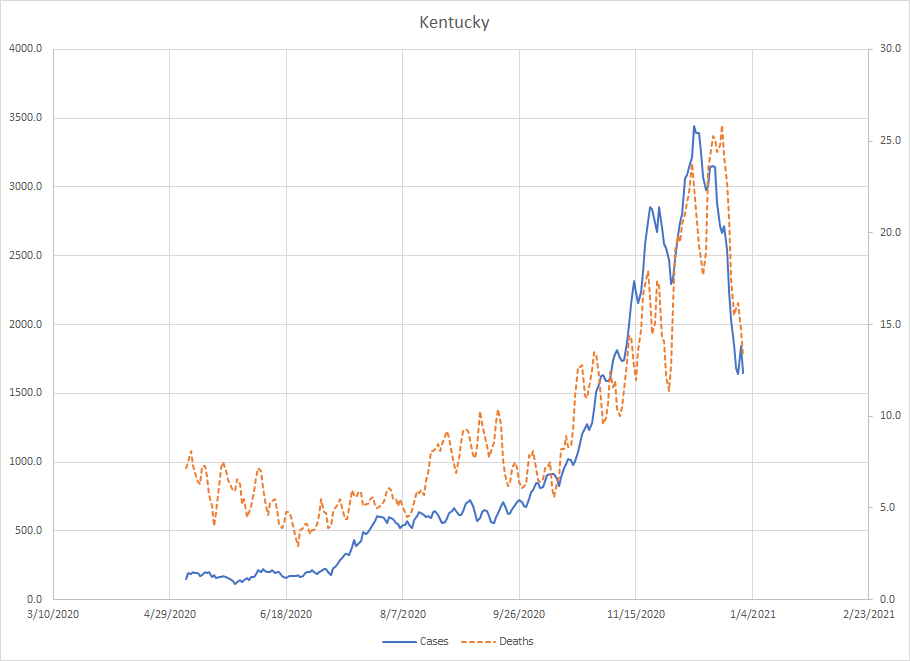
Kentucky – They had a very small increase in July but really hadn’t seen a spike until mid October when cases really started to climb. The current peak in cases was on December 11th and for deaths it was on December 22nd. The drop off is larger than I’d expect just due to a disruption but I’ll keep them in the “cautiously optimistic” zone. In other words, I think the worst is over but it happened too close to the end of the year to really say it with full confidence.
Tennessee – Not sure what to make of the fact that deaths overlay cases. That happens in other places as well. The situation here is very similar to Kentucky with a small rise in cases starting in late June and then cases really accelerating later in the year. The peak in cases was on December 18th and we’ve seen a bigger drop off than we saw at Thanksgiving so it is unlikely we see things start to ramp up again. Another place where the worst may be over but can’t say it with full confidence.

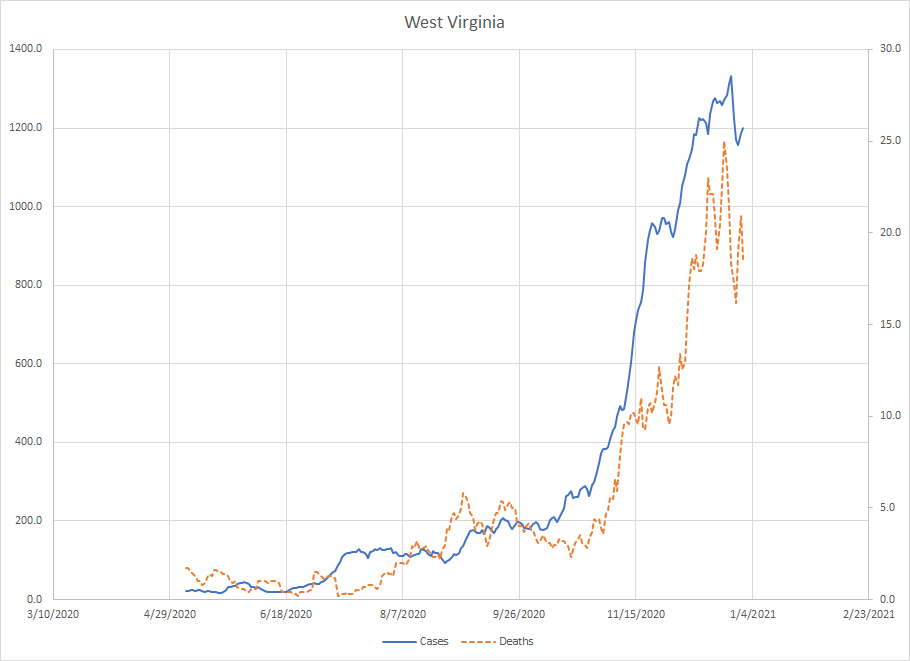
West Virginia – Another state where there wasn’t really an exponential phase until things started to climb in mid October. The peak in cases was on December 26th which is right at the two month window which tends to be how long the up trends last. But since we are so close to the end of the year, we can’t say with high confidence that the worst is over.
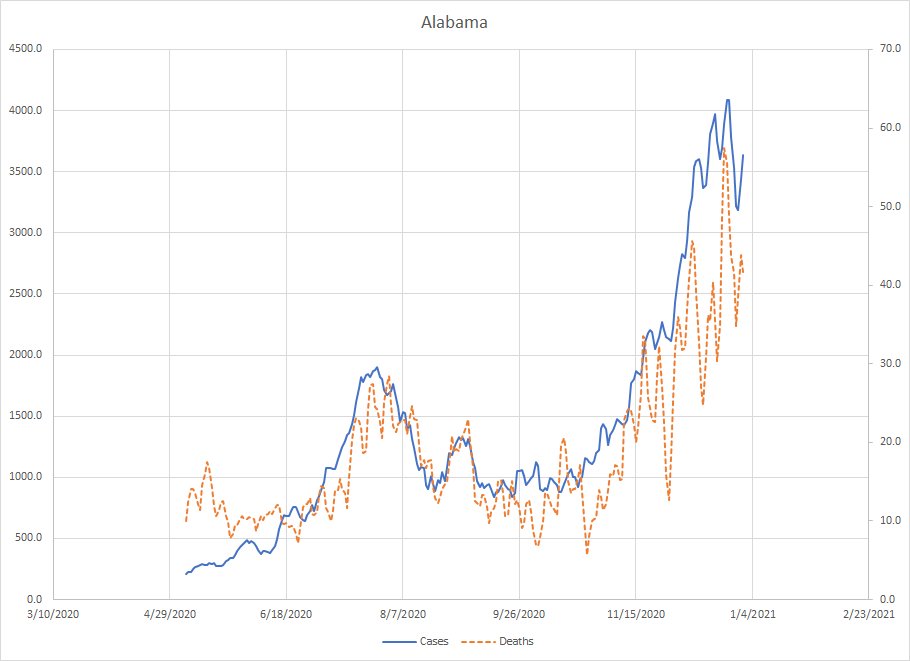
Alabama – The first of many places where you see the summer Sun Belt peak. The fall rise started around October 21 and the current case peak in on December 25th which again is about the two month window. But even with the drop at the end, there is not enough data to confidently say the worst is over. Another place where I want to be cautiously optimistic.
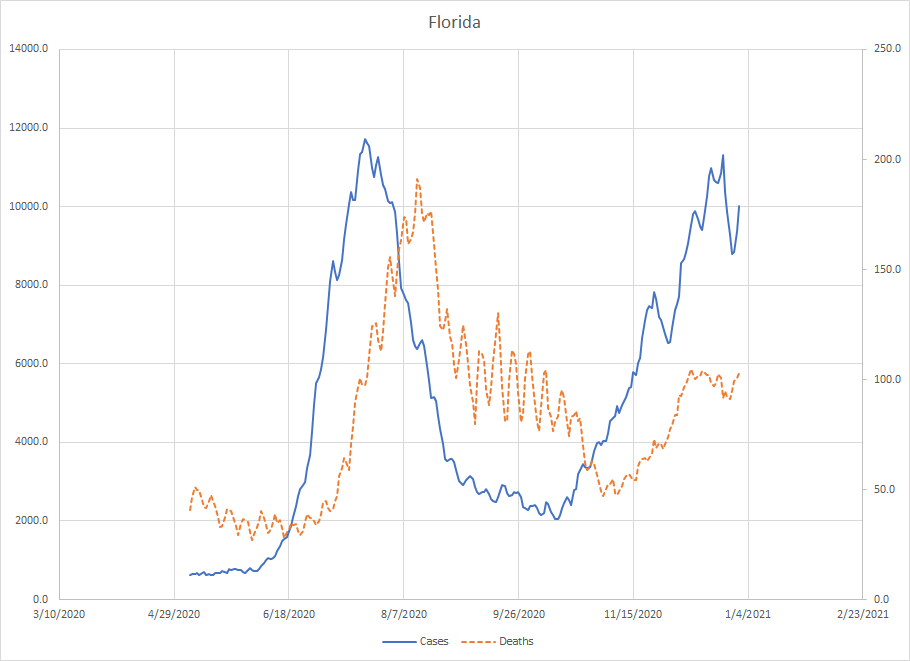
Florida – Another place with a summer peak. The fall rise started roughly on October 13th and what is interesting here is that death numbers are still below the summer. The fall case peak right now was on December 24th but deaths have not started to drop – they are mostly flat. We do need to see what happens when things get back to normal.
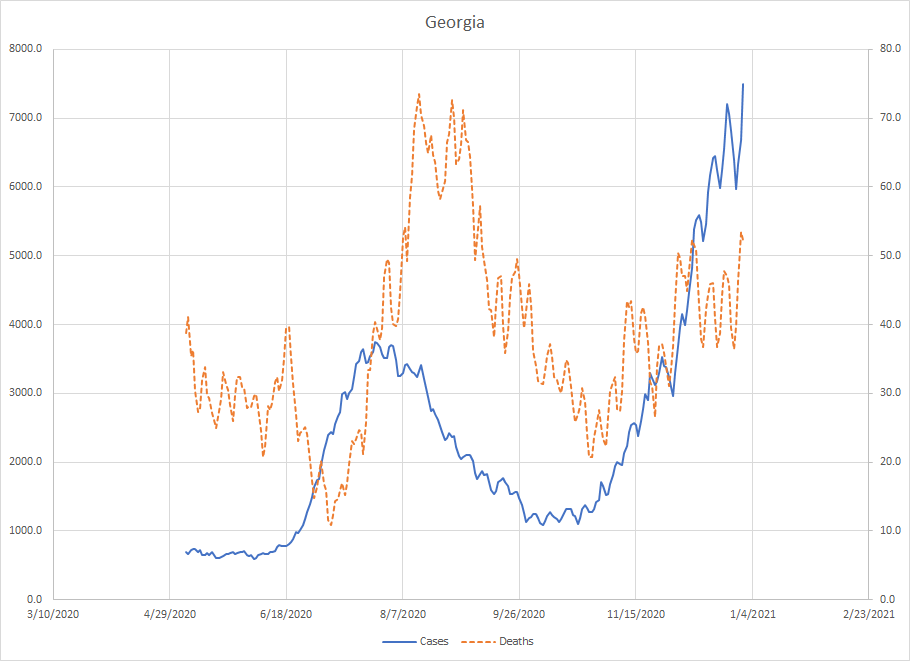
Georgia – Similar to Florida in that the current numbers for deaths have not reached what was observed back in the summer. The current rise started mid to late October so we are near the end of the two month window but there is not yet evidence of a drop. So, like New York, we have to watch the first two weeks of January to see what is really going on.
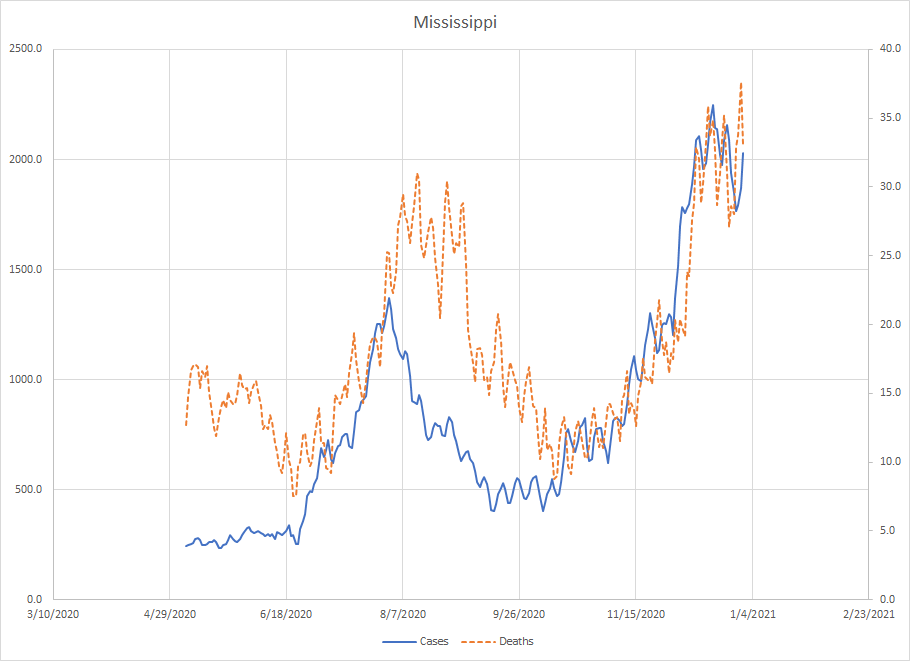
Mississippi – Hard to really pin point when cases started to go up this fall. The graph is kind of spiky because Mississippi has lots of gaps in reporting but it looks like things didn’t really get started until early November. The current peak for cases was on December 16th and things have been relatively flat for both cases and deaths since mid December. Some places do have relatively long flat periods before things start to drop but this is another state where I’m not comfortable identifying a trend and we need to wait and see how things look in January.
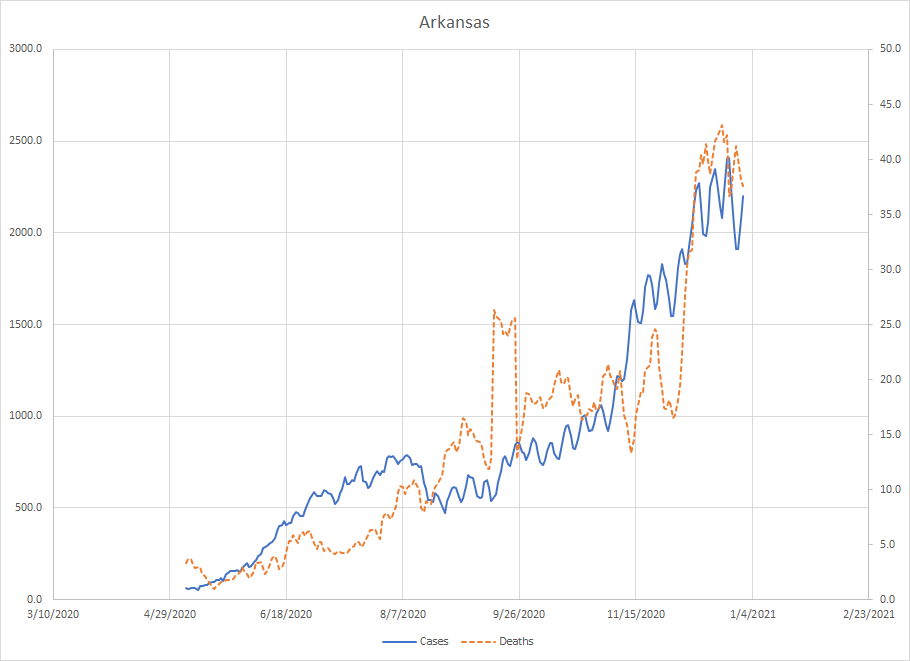
Arkansas – They did not have the obvious summer peak that other places in the south did. Cases started going up mid September but it has been an uneven rise without a real long period of exponential type growth so Arkansas is kind of an outlier. Cases and deaths have been flat since mid December. I’m going to put them with Mississippi because this could be a false plateau due to disruptions and we could see things take off again in January when reporting gets back to more normal levels. Or they could start to drop. Have to wait and see.
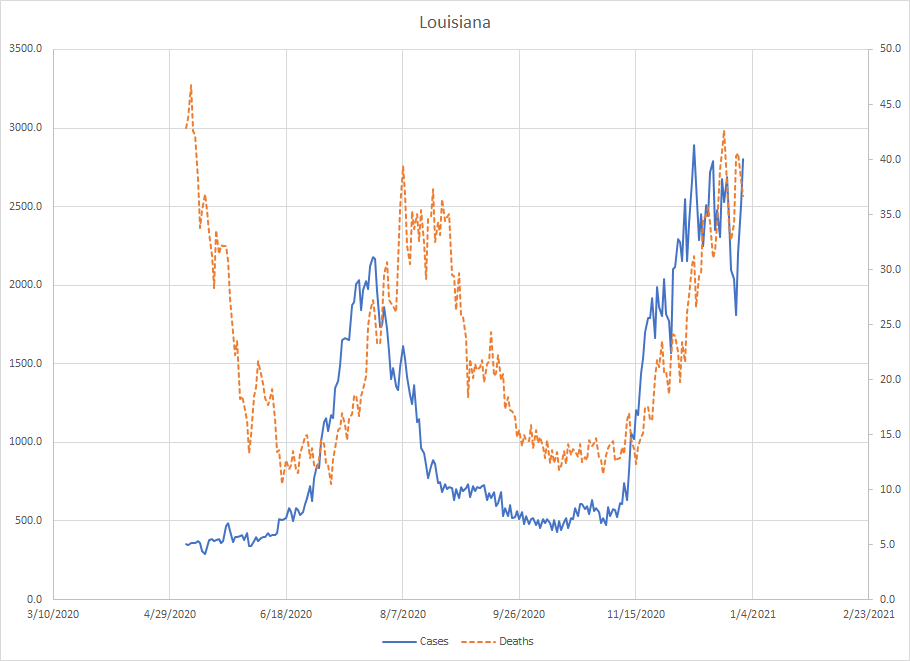
Louisiana – We get the tail end of the Mardi Gras effect in the spring and we have the summer rise like the rest of the south. Cases started to accelerate in early November and deaths started to rise as well. The numbers passed the summer peak but not what happened in April. Cases have been flat since early December so we put Louisiana in the same category as Arkansas and Mississippi. Again we see similar patterns in states that are close together.
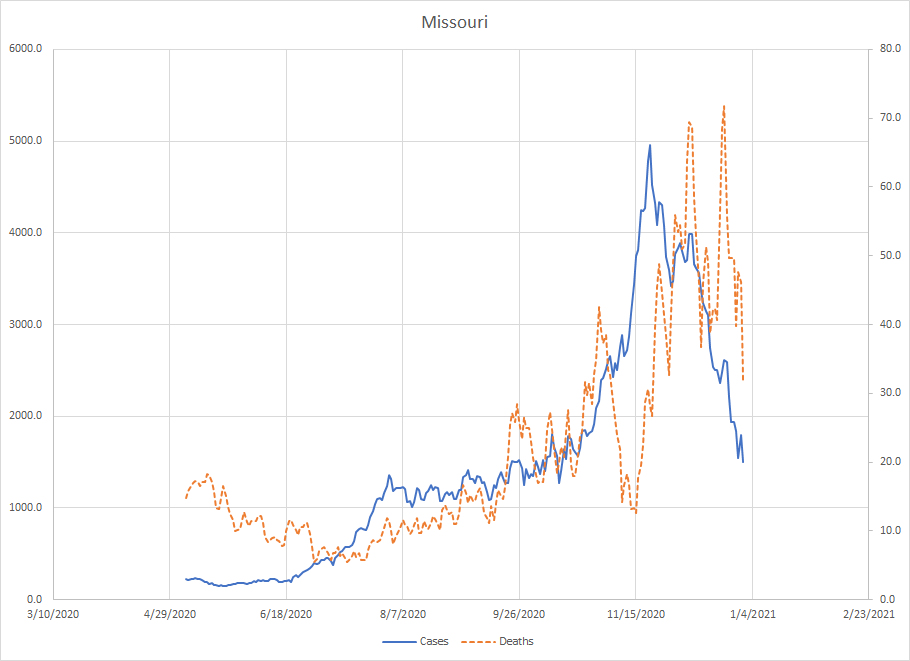
Missouri – More of a border state but further west than the rest. Another place where we did see a small rise in July and then cases started to trend up again but didn’t really take off until late October. Here, cases peaked on November 21 and deaths on December 23rd. The drop off in cases has been almost as steep as the climb and deaths are starting to follow. That looks to be outside any disruption so I’d be comfortable saying the current wave is over and things are clearly improving here.
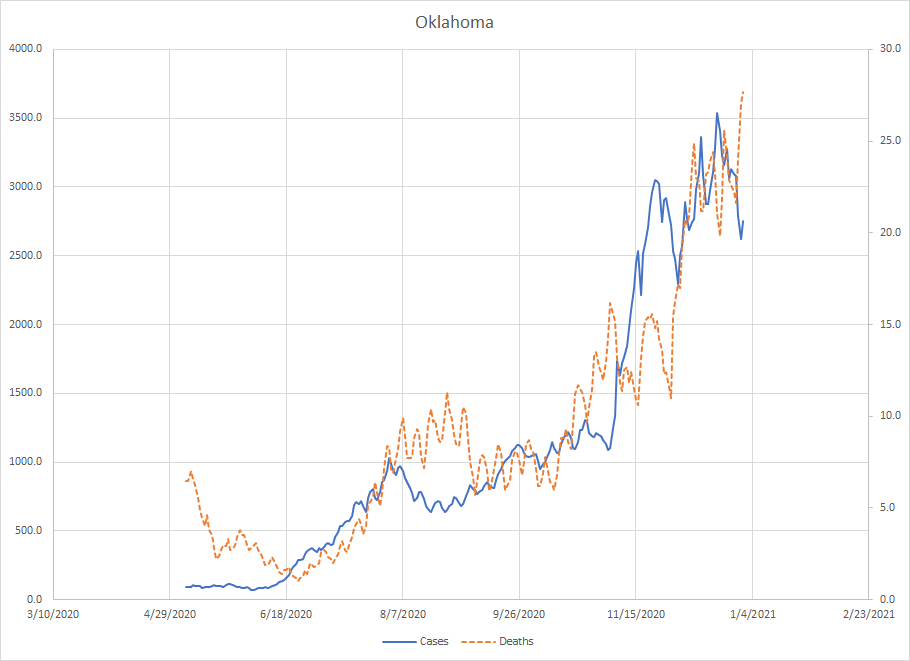
Oklahoma – I don’t know if they are truly southern but they are the most southern of the plains states so I put them here. Kind of looks like Missouri with a small rise starting in mid June and then things accelerating starting around November 4th. Similar pattern to Missouri but the fall rise started later. The current peak in cases was on December 20th and things have not started to drop. Probably should have said they are more like Arkansas in that we need to see the first couple of weeks in January to know what is really going on.
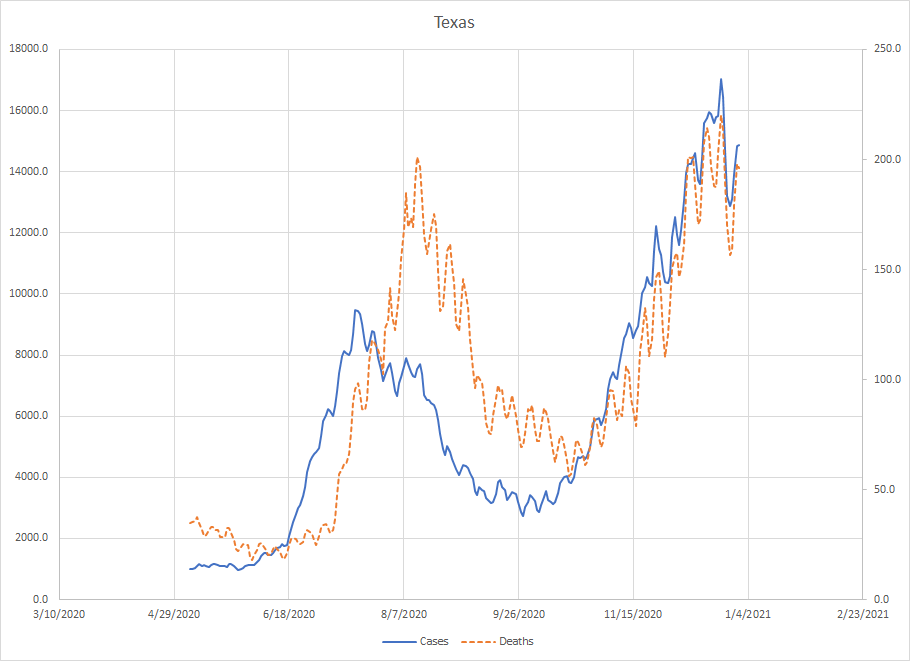
Texas – Texas is like California in that it is a big state and the climate varies from place to place. You had the summer wave like the rest of the south and then cases accelerated again in mid October. The current peak was on December 23rd but we haven’t really seen things start to drop off. Another place where things are currently flat but we don’t know yet if it is a real top or just due to end of year disruptions.
We have a region with a fair amount of uncertainty. The worst does seem to be over in Missouri and it is trending that way in a few other places. Most of the states here are have flat trends in both cases and deaths and we’d need to see additional data in January to know if this was a real top or an artifact due to the end of the year disruptions in reporting.
