

My local cable company owns a news network. Last night, I’m logging in so I can watch the Sunday night football game and they have a little news splash on the main page. The headline was something like “Nation braces for post holiday Covid surge.” Are you bracing yet? I’m not. Maybe I should be. Honestly, this type of headline does nothing except spread more fear.
I still expect some disruptions from the long holiday weekend but, for the week that ended on Saturday, we did set another new high for tests with over 12 million. But the number of positives declined slightly. The percentage of positive results dropped from 9.8% to 9.4%. Given the holiday weekend, we have to avoid drawing premature conclusions. But we did break a seven week streak of consistently increasing positive results.
Hospitalizations and ICU are still rising which means we haven’t hit a top yet. I’ll show the graphs this time. We got a bit of a head fake this week because the number of people hospitalized did drop on the 27th but it went up the next two days. It is true that we see the week over week change slowing. Two weeks ago, the increase was over 25%. It is now around 10%. Still going up but at a slower rate.

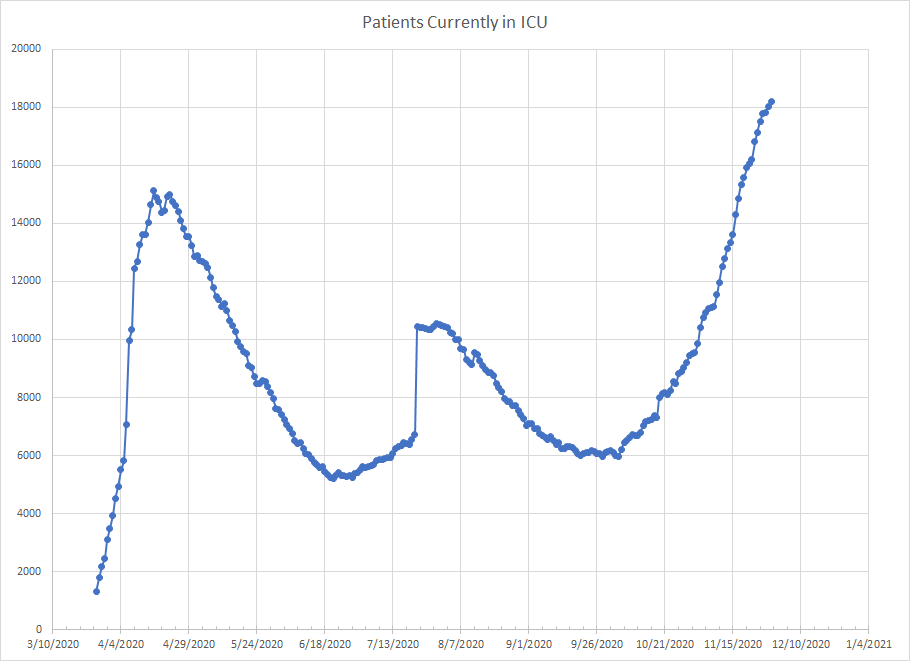
We have a similar story for ICU occupancy. Still going up but at a slower rate than it was two weeks ago. Now we did have the long holiday weekend but it seems likely that these would be less impacted than testing. Still, we need to see these start to decline to really confirm that we’ve gone beyond a peak of cases.
Based on actual cases, the ten states with the fastest rate of increase last week were Ohio, New Mexico, Wyoming, Pennsylvania, Alaska, West Virginia, New Hampshire, Colorado, Minnesota and Michigan. One thing to point out is that we had no states with more than a 20% increase which is the first time that’s happened in a bit. The caveat is that long weekend likely reduced the number of tests and number of cases so we won’t make much of this unless it confirms the next couple of weeks.
I did update all of the graphs with the end of another week. All data comes from the COVID tracking project which takes it from the various state websites which sometimes have their own issues and glitches. I’ll do the two week graphs later this week but I wanted to focus first on the ones that pool over a four week period. This is going to be more conservative and it still shows most states in a period of increasing positive results. I’m fine with this because this is not likely to show a downturn until we’ve really gotten past the peak.
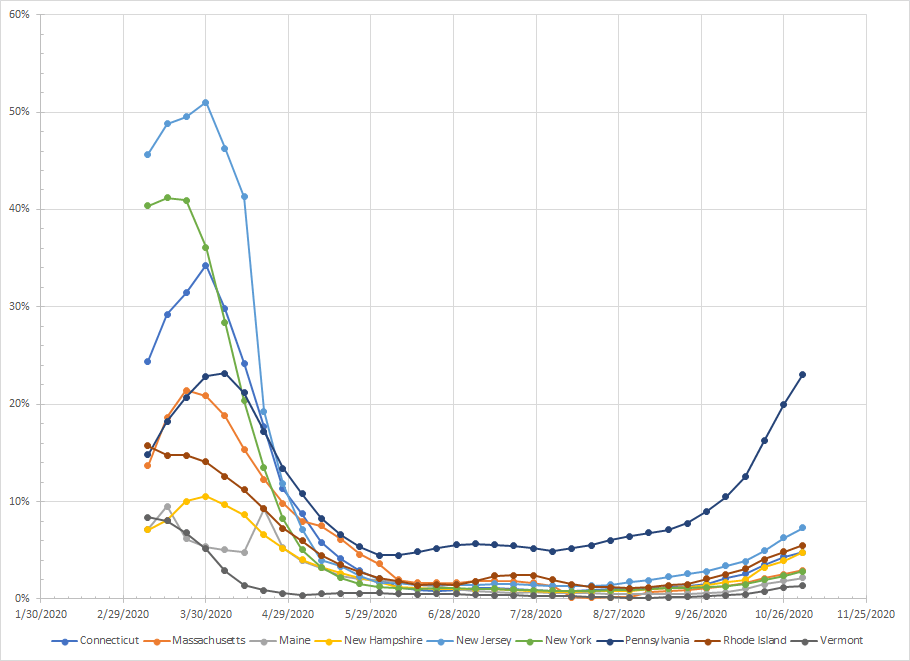
So what you’ve got is the total percentage of results that were positive. Each point represents four weeks of data. The points are from the beginning of the time period so the last point covers the period from November 2 to November 29.
Not much change in this first group. Hard to tell from the graph, but, even though Pennsylvania was in the top ten, the rate of change has slowed a bit. New Jersey is still going up but not really that fast and all but Pennsylvania are still below 10% positive. New Hampshire is also on the top ten list but they still aren’t close to 10%.
Another region with not much to say. Some slight increases in Virginia, Maryland and Delaware but they are slow increases – not really showing exponential growth which happened back in the spring. All of them are also below 10% positive. This area is still not a problem.

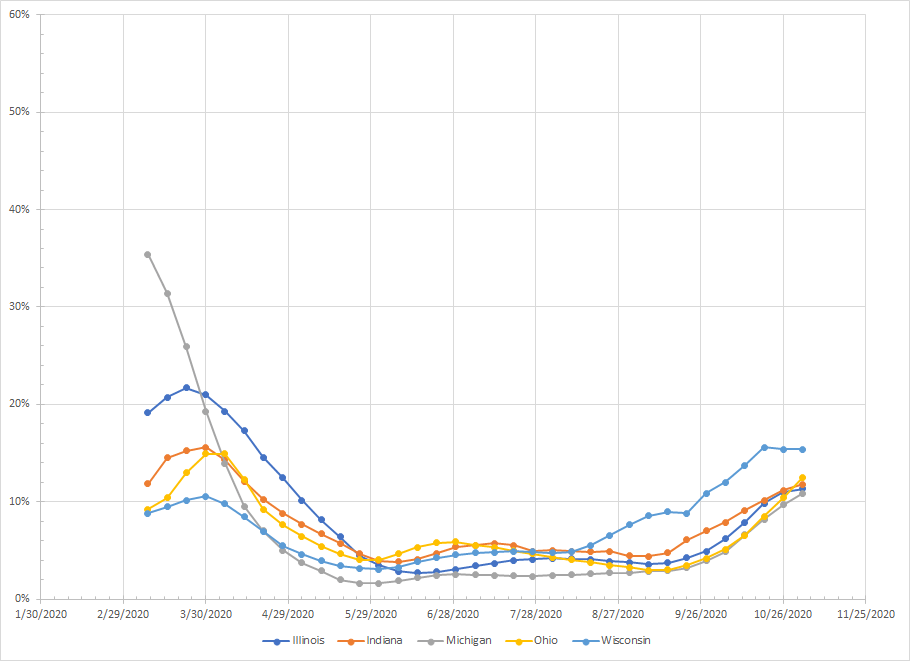
Ohio and Michigan made the top ten list. Of the two, the increase in Ohio looks more problematic. They were even until the last two data points where Ohio has pulled away and actually now passed Illinois and Indiana which look like they’ve flattened. Wisconsin is clearly no longer increasing. The rate is still high in all the states but it continues to look like the worst is over in Wisconsin and Ohio is maybe the one to watch.
West Virginia made the top ten list but rates are going up in all three states. West Virginia starts from a lower number so the same type of increase is going to be a higher percentage. Kentucky has kind of flattened out and both Kentucky and Tennessee are over 10%. This region really wasn’t hit hard back in the spring so maybe things are catching up. Although the rate of change in all three isn’t that bad. Like a lot of the states in the Northeast, they are still going up so we have to watch but things don’t look problematic.

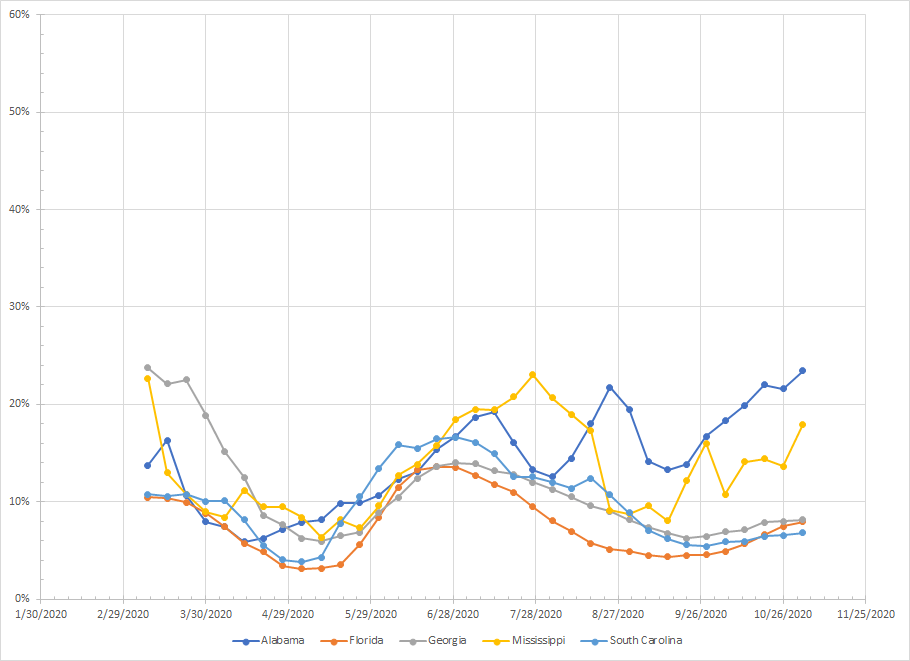
Even with the smoothing, Alabama and Mississippi just jump all over the place. Maybe Alabama is trending upward and I have no idea what is going on with Mississippi. Both of them are above 10%. Florida looks like things have slowed down and Georgia and South Carolina remain flat. We’ve got two states to watch but neither one is really surging.
Here’s a region where there is some reason for optimism even with Minnesota on the top ten list. All are above 10% but we see Minnesota, North Dakota and South Dakota turning down. Iowa and Nebraska look like things have slowed but we need another week or so to confirm. Have to caveat all of this until we know how much the holiday weekend distorted things. It is possible that the worst is over for this region.

Another region where the overall rates are high but where we don’t see a real surge in cases. Oklahoma went up so they need to be watched. Kansas and Texas were flat and things seems to have slowed in Missouri and Arkansas. Again, most of the states are still showing an increase but not a lot of evidence of real exponential growth. Mostly a non problematic region.

In this region, Colorado, Wyoming and New Mexico were on the top ten list. All of the states are over 10%. This remains the most problematic region but even here there are things to be slightly optimistic about. Montana, Utah and Colorado were basically flat. Montana had been on a real growth curve since the end of August and I want another week or so to be sure this is a top. Still have things increasing in Idaho, Wyoming and New Mexico. But if we’ve gone from all six increasing to just three, that is a step in the right direction.

Now we get to the last group where Alaska was on the list. Clearly my data set has some glitches there – though it was fixed but it cam back. Washington has also stopped reporting negative results. Supposedly, they’ll back fill all that data this week so there isn’t much that can be made about that. Arizona and Oregon are rising the fastest. Kind of a mixed bag and until we get clarity on the data in Alaska and Washington. Oregon looks to be the most problematic.

So that’s where things stand. We do need to see how things shake out this week and how much of a disruption we had this weekend. But there are plenty of small pockets of optimistic numbers and only a few states where things are really surging. Still far too early to suggest that the worst of it is over.
