


One thing I’ve managed to change in my life is to take a more optimistic view of things. Maybe I was always a natural optimist just hiding or maybe it was rewiring my brain. I think part of it was being the manager of a group for many years. Not that they want a cheerleader blowing smoke up their you know where but someone who can look at a volume of work and a tight timeline and say “we can do this”. And mean it by the way. Nobody wants the person telling a team down 65-0 with 30 seconds left that they can still win.
Anyway, I prefer being an optimist. I think it just makes you happier. I think also that if you radiate positive energy, you attract. And, conversely, if you radiate negative energy, then you attract that. Still, with this particular virus, I need to make sure I’m not looking through those rose colored glasses since I’ve been overly optimistic in the past. I’ll try to just point out where the trends look good and where they don’t and leave it at that. I will say there are more little points of light this week than in past weeks but we can’t react too much to a single data point.
One thing I’m reasonably sure of is that cases follow a predictable pattern. You get an exponential rise which looks scary as hell and then things plateau for a bit before eventually falling. The length of the plateau varies quite a bit from place to place and time to time. So I just want to start with a comparison of the US to Europe. This is WHO data which is slightly different than other sources I use for the US. And we plot cases by time.

This is as of November 19th. There was one day where US reporting must have missed the deadline because there is a 0 followed by something over 250000 where two days were combined into one. This is based on case count so the issues in the spring are completely overwhelmed by the fall where testing volume was significantly higher. The European data is a mix of places and is noisy but there was a gradual climb until the end of September when things just exploded. The peak was on November 6th and you’ve just had random bouncing since then. The US was roughly 2-3 weeks behind – pinpointing the actual start is open to interpretation. Inferring US results from Europe is tricky so I won’t do that. Just really want to point out that you don’t stay on that exponential climb forever.
So let’s get into the numbers. For the week that ended Saturday, the US set another all time high with over 1.1 million positive tests. That is a factual statement but it is sorely lacking in context because the US also set an all time high with 8.5 million negative tests. What is probably more important is that the percentage of positive results for the week was 9.9%. That just a little higher than where we were last week (9.7%) and the smallest week over week change since things started increasing back during the last week in September. That is a small point of light but we need to see another week or two at this level before this potentially becomes a top.
I’m not going to show the graphs of hospitalizations and ICU occupancy. As of yesterday, there were 83,870 people with COVID hospitalized and 16,219 in an ICU. Both are highs and both are still trending up. But it is also accurate to say that the day over day change has slowed. And it is accurate to say that we’ve had other periods where the day over day change has slowed and then picked up again. So I don’t have enough data to really feel comfortable drawing any real conclusions.
At the risk of repeating myself, you should take any daily death reports with many grains of salt because they aren’t reporting deaths that occurred on that day. There are serious lags between when a death occurs and when a state reports it. Which is why I’m only using the CDC for this and the limitation is that it will be another month before we really get clarity around deaths occurring at this time.
Still, there is enough information to make some statements. It looks like we hit a three week bottom that ended on October 3rd. After that, deaths started climbing. Remember that deaths will rise and peak later than cases or hospitalizations. Over the first four weeks of October, deaths rose from 3910 to 5254. If you look back to the summer, the rise over the first four weeks was from 3796 to 7121 with a peak two weeks later. The numbers are going to increase so we can’t make any hard conclusions now.
If I look state by state, things are still increasing in 43 states. Results are basically stable in 7 and decreasing in 1. My counts include DC which is why you get to 51. In terms of cases, the ten states with the largest percent increase over the week are New Mexico, Vermont, Wyoming, Colorado, Minnesota, West Virginia, New Hampshire, Michigan, Montana and Ohio.
Now let’s get to the graphs. As a reminder, this is percentage of results that were positive over a four week period. The graph is a rolling total so each point represents four weeks of data. I looked at this to make my determination above as to which states were increasing, stable or decreasing. It smooths out a lot of the week to week variability but it is also going to be conservative when it comes to signalling a change. But I’m totally OK with using a conservative signal as it tamps down my natural optimism.
We start, as always, in the Northeast. In this group, Vermont and New Hampshire made the top ten list in terms of case growth but Vermont only has 3629 cases so I wouldn’t make too much of it. Pennsylvania is the worst of the bunch and is above the national total. The others are all still curving up but at a much slower rate. New Jersey is starting to separate from the pack a bit but still far below where they were in the spring.

Into the next region which is a little boring but boring is a good thing here. All are below the national total and there are small rises in all places but you have to look really close to see it in North Carolina or DC. Maryland may be trending up faster than the rest but it is hard to look at this group and see a problem.

Now we come to my part of the country. Here we do get a bit of good news in that the rise in Wisconsin may have stopped. Wisconsin was the hardest hit in this area in this wave and if things have slowed there, it would be good news. Things still going up in other places but Indiana and Illinois may also have slowed since all four of them now cluster right around 10%. Not great but it doesn’t look like any of these places are still in an exponential growth phase.

As we continue across the country, in this next bunch, I was concerned about Kentucky last week but the trend didn’t continue. Now Tennessee looks like the problem as the line has been steadily increasing although not at a really extreme rate. West Virginia is up a bit but still below the national total. Minor concern with Tennessee but not really a problematic area.

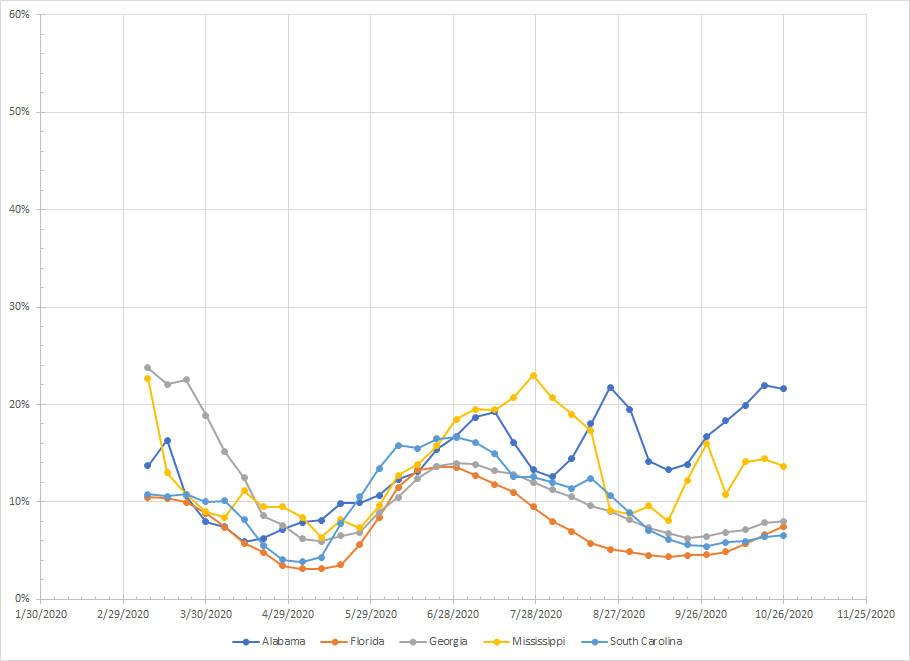
Next, we go into the deep South. Alabama and Mississippi just kind of bounce around but neither seems to be trending up. In fact, Florida is the only place where the curve is moving up although they haven’t crossed the 10% line. The percentages in Alabama and Mississippi are higher than the national total but unless Florida states to spike, this area doesn’t look especially problematic.
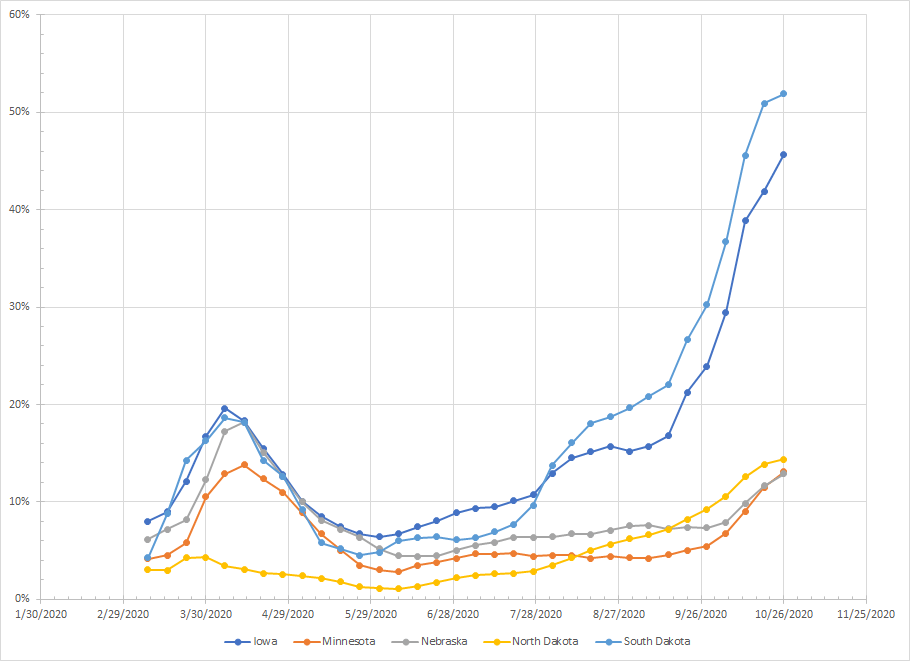
The same can’t be said for our next group of states as all of them are above 10% positives. There is evidence that things have slowed in the Dakotas but not in Iowa, Minnesota or Nebraska. Minnesota was the only one to make the top ten list. One of two areas that still remain the biggest problems. That could change in a few weeks if the trend in the Dakotas holds up.
Louisiana is the only state in this group that falls below 10% and they are only showing a slight increase. Texas has been trending up but at a very slow pace. Arkansas, Oklahoma and Kansas each showed slower growth in the last four week period – still an increase but not a strong upward trend. Missouri is the only one still showing a strong trend. Kansas and Missouri have a high percentage of positive results. The next two weeks should confirm if this part of the country has really peaked.

To the Rockies where all of the states are over the 10% national total and four (New Mexico, Colorado, Wyoming and Montana) are on the list where cases are growing the fastest. I’ll call this the most problematic area in the country right now. Wyoming appears to be the only place where growth looks exponential though. Still, even an optimist like me doesn’t find a lot of good in this graph.

Here is the rest of the country. I have no idea what is going on with Alaska. I suspect an error in the data since the number of tests went sky high leaving the percentage of positives close to zero. We have a few states (Arizona, Oregon and Washington) where the curves are increasing so they need to be watched – could be the ones to extend this wave. California shows some growth but is still far below the 10% national total. Hawaii is trending down and Nevada looks to be flat.

My potentially overly optimistic take is that the wave is peaking in the Midwest but still going in the Rockies and may now move a little further west.
A word of caution about this week. I have no idea how reporting is going to go since we have a big holiday on Thursday. It is possible we will see the number of cases drop simply because labs have to slow down over the holiday weekend. Then, we might see big spikes early next week as they clear out the backlog from this week. So if we get to Tuesday of next week and suddenly the networks are reporting a huge spike in new cases, don’t get too alarmed.

Thanks for doing such a good job!
Barbara
You’re welcome. Hopefully, just trying to bring a little balance to things because I’m tired of the scare headlines with numbers taken out of context.