

Let’s start with a confession – I don’t consume a lot of news mostly because I think they don’t really inform. It is really about grabbing your eyeballs and keeping them on their channel or clicking stuff on their website. So I don’t really know how things are being covered except for the few headlines I see from various sites.
But it appears our state may have made some kind of news. The governor did sort of roll things back in response to the recent increase in cases although it was really just to re-establish limits on gatherings, particularly in hard hit counties. My wife got a text from a friend way out west who wanted to make sure we were all OK since they heard something on the news.
The only thing it seemed to do was trigger blind panic because our store was basically out of toilet paper again. Vague rumors about another shut down was enough to drive people to start hoarding again.
So lets get to the numbers. I am probably just going to start talking about cases even though when I say cases I am referring the percentage of results that came back positive. Raw case counts are partially influenced by the number of tests so I don’t see it as a truly reliable measure anymore.
For the week that ended on Saturday, the US hit another new record in tests with over 10 million recorded. But the most important thing is that 9.7% of them were positive. This is a big increase over last week and is higher than anything we saw during the summer wave. And more states are participating as 40 of them hit a new local high last week (I’m not comparing back to April so this is just in the last couple of months).
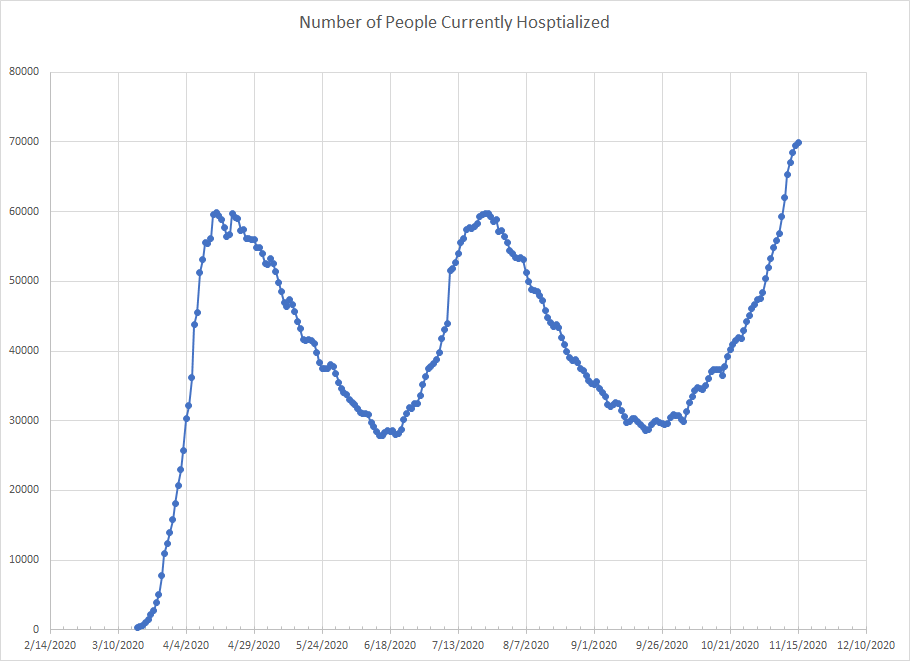
Per the Covid Tracking Project, there were 69,864 people hospitalized as of yesterday. If you look at the curve, the last couple of points suggest that the rate is slowing. I’m not going to make much out of this though. I think as we spread to more states that we may see another leg up. Now one problem with presenting this graph and the next one is that I don’t have the right context. This number is important but without understanding how many people are typically hospitalized at any given point in time, it is hard to put it in the proper context. From analysis I’ve seen, we seem to be fine with respect to capacity so, while this number is higher than the first two, it is spread over more places and so we don’t see places getting overrun.
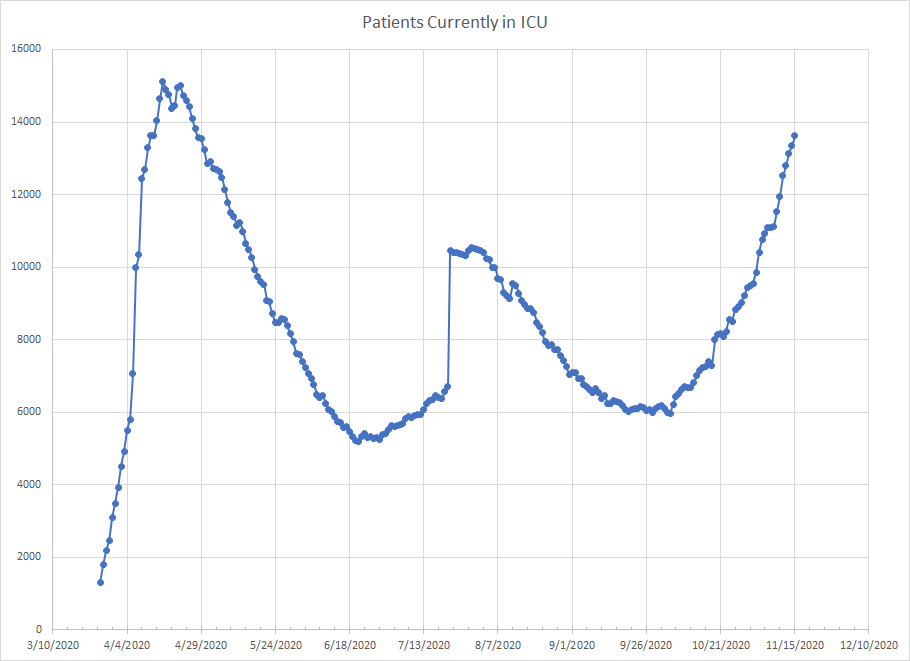
The next graph is for ICU which currently sits at 13626 people. The rate of increase is still slower than we saw in April and we still haven’t passed the peak in April although as the wave continues, we could certainly do that. Still, it seems to me, that having more people in hospitals but fewer in the ICU is a good thing. Probably related to advances in therapy which may keep some people from going critical.
When we are in this period where cases are accelerating, it looks scary. It looks like things are just going to keep climbing forever. We have no real way of knowing. Past history suggests that you get a period of rapid increase, followed by a plateau and then things start to drop off. I’ve been looking at the states that were problematic early on to see if there is any evidence of that. Right now, there are hints but no real strong evidence.
One of the things I do with the numbers is make a simple forecast of expected cases one week in the future. I do that based on the current cases and the average number of new cases. Here I am using raw case counts because the percentage just don’t work as neatly. If a state is in the rapid acceleration, my forecast is off. As things level out, the forecast gets closer to correct. As things start to drop, I’m overestimating the number of cases.
And the four states that were the worst (Wisconsin, Montana, North Dakota and South Dakota) are no longer the places where my forecasts are way off. Currently, the ten states that I underestimated the most are Vermont, Wyoming, Colorado, Michigan, Minnesota, New Hampshire, Ohio, Kansas, Indiana and Connecticut. This doesn’t mean it is over in the other places or even that the worst is over. Can’t really make that a definitive call until we’ve established a true pattern.
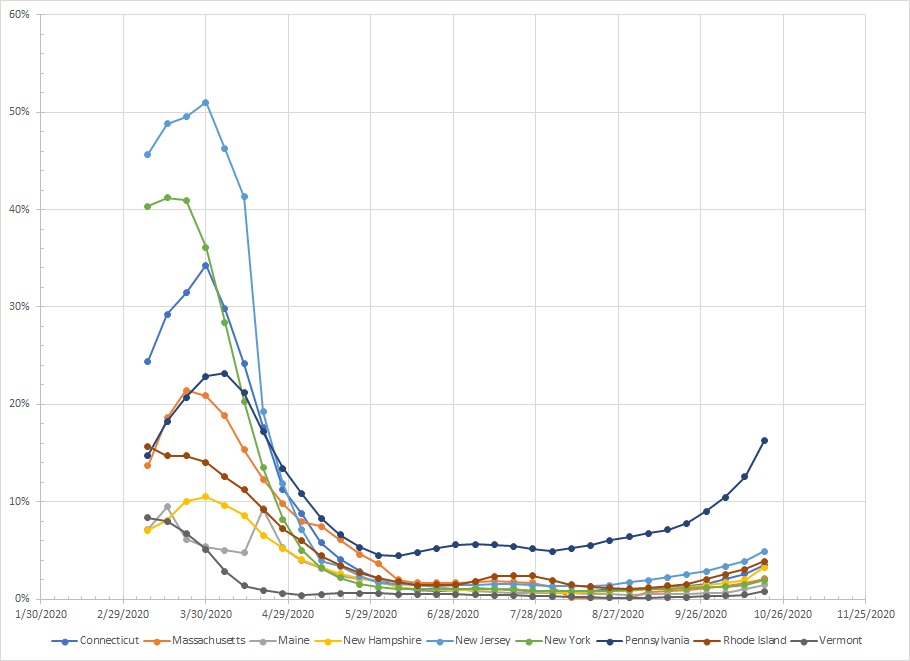
Now we get to the graphs. As a reminder, what I’m plotting is a rolling four week total of the percentage of tests that were positive. The use of four week blocks smooths the data out. It might smooth it a little too much meaning that it will dampen a sharp increase but I also don’t want to over react to a single data point. But the four week total is why the graphs won’t really match the text above.
For example, I said Vermont was the state where my one week projection was off the most and it is grey line at the bottom of the graph and certainly doesn’t look like an issue. Based on this four week total, all of these states (except Pennsylvania) are below the 9.7% we have for the country. You are seeing all of them starting to curve upward although at a much slower rate than Pennsylvania.
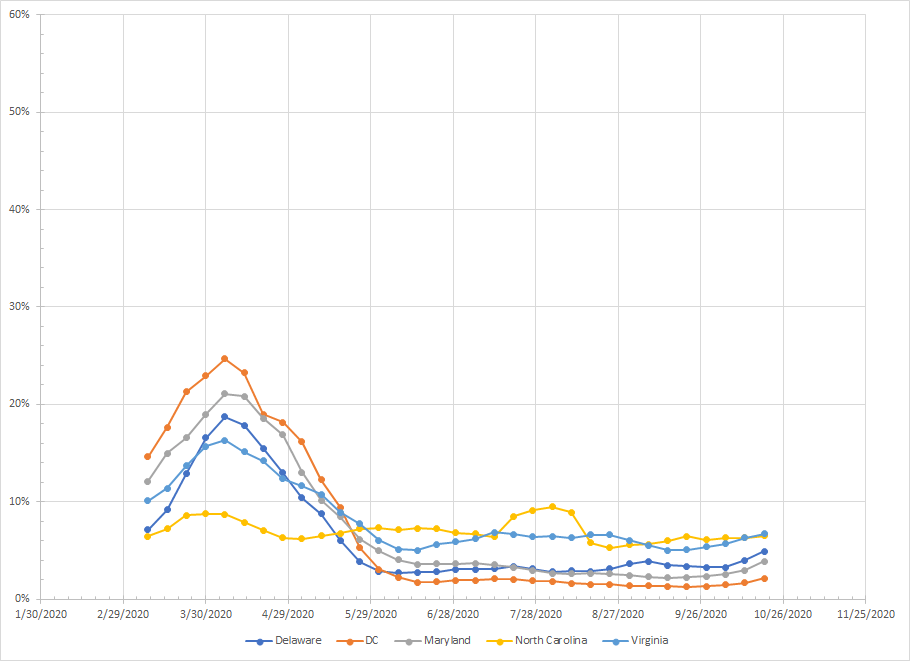
In this next group, we see a few of them starting to curve up but all are below the 9.7%. North Carolina continues to just be flat. Like the Northeast, while we are seeing increases, this is not a problematic region right now.
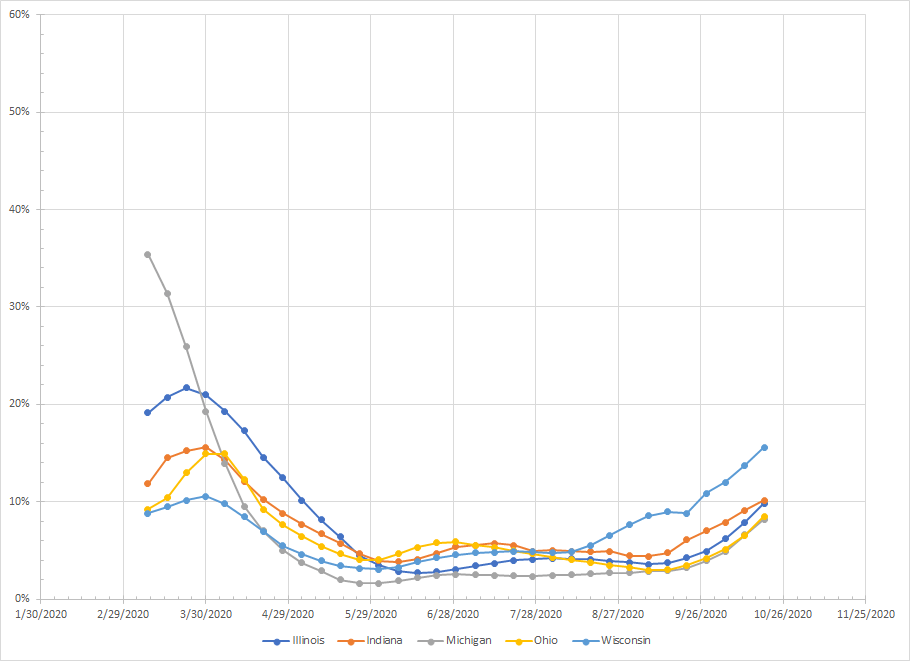
A note on Wisconsin so you can better understand my comment. Over the last four weeks, the percentages have been 16%, 15.9%, 13.9% and 16.8%. Before that, they were in the 8%-9% range. If they stay within that range this week, then the line will start to flatten. Its why I say they are no longer increasing as fast as other places but I’m not confident enough to say this is the top. The other states are going up and they are all right around the 9.7%. The rate of increase in Indiana is a little flatter than the rest but not enough to really prove anything.
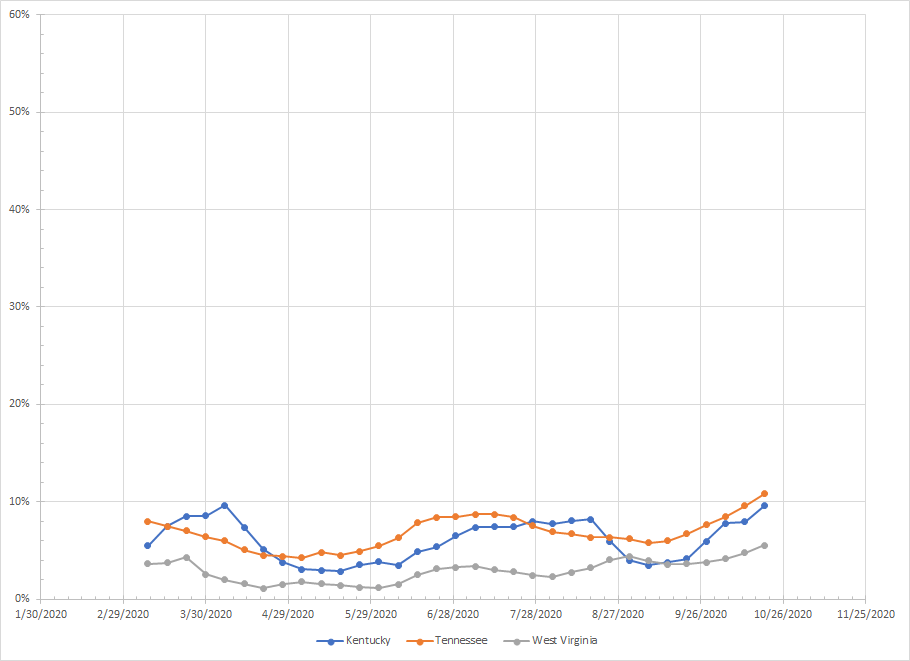
Three states with slightly different stories but all showing increases. A sharper rise for Kentucky and Tennessee is no longer flat. Both are also right at the 9.7%. West Virginia is slowly going up but below the national total. Kentucky might be the one to watch out of this group.
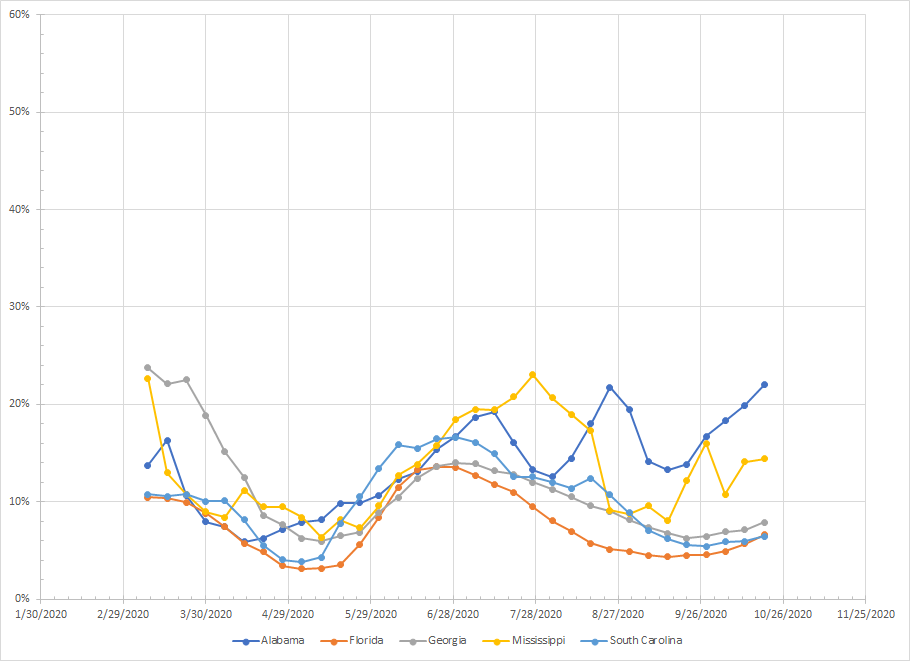
The mixed bag of the South. Alabama is clearly trending up and is double the 9.7% figure for the country. Mississippi is above that as well but just kind of randomly bouncing around – guess it can’t be smoothed. We have smaller upswings in Georgia and Florida while South Carolina isn’t really showing an increase yet. Like some of the other states above where were are seeing a slow gradual creep up, we need a few more weeks to know what we are really going to see.
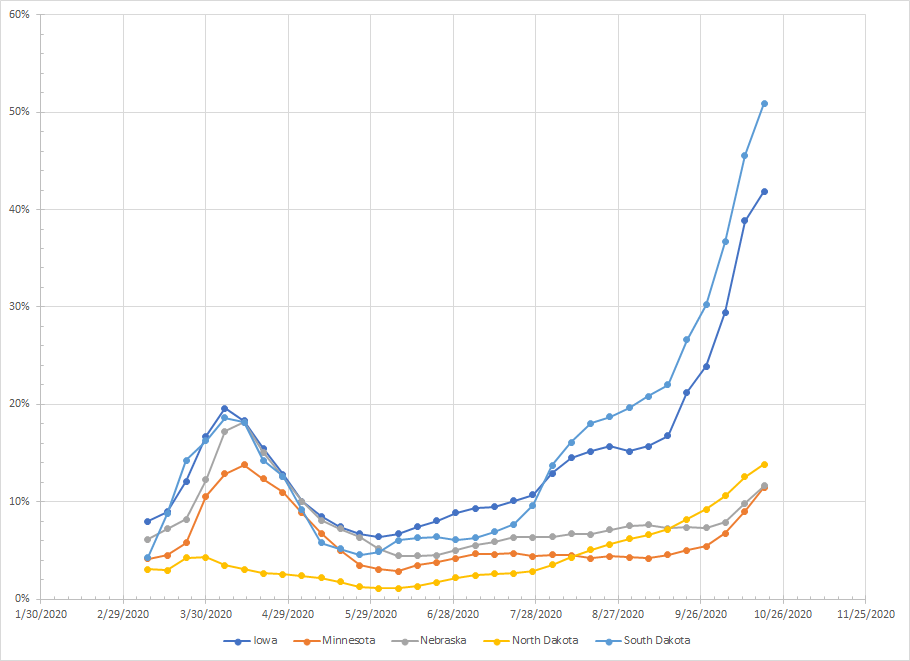
You are looking at South Dakota and thinking I’m crazy for suggesting they are slowing down but like Wisconsin it will take a couple of weeks for it to show up in the graph – assuming the trend holds. All of these states are above 10% and Minnesota and Nebraska are starting to trend up. Still a region of concern even if things are slowing in the Dakotas.
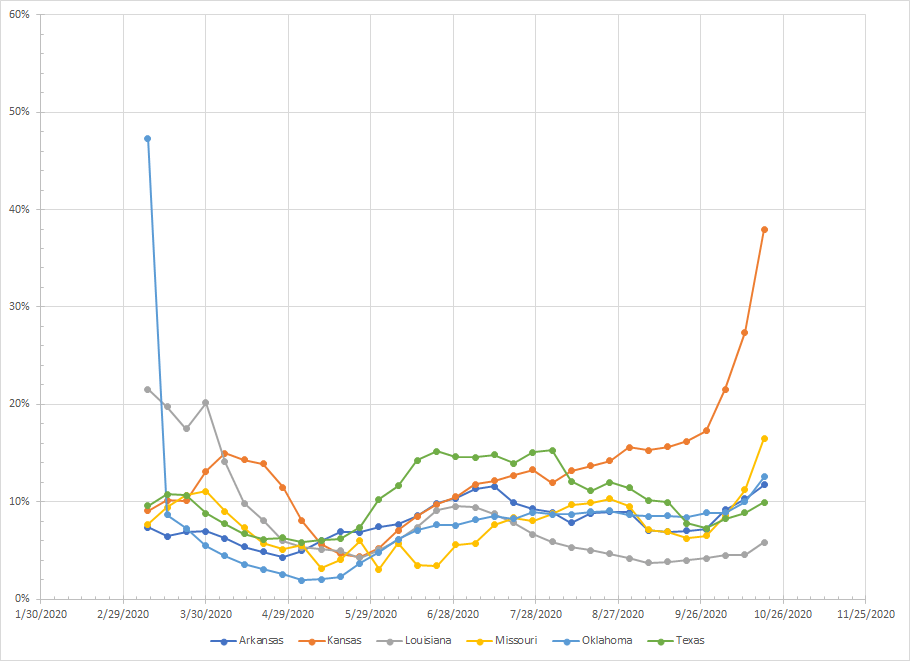
Kansas and Missouri are the story here (only Kansas was on my top ten list) but both are showing strong upward trends. I can’t really speak to how testing is done in Kansas but like Iowa and South Dakota, the percentages are crazy high. The other states are trending up although it appears stronger in Oklahoma and Arkansas than Texas and Louisiana. Louisiana is the only one below the 9.7%.
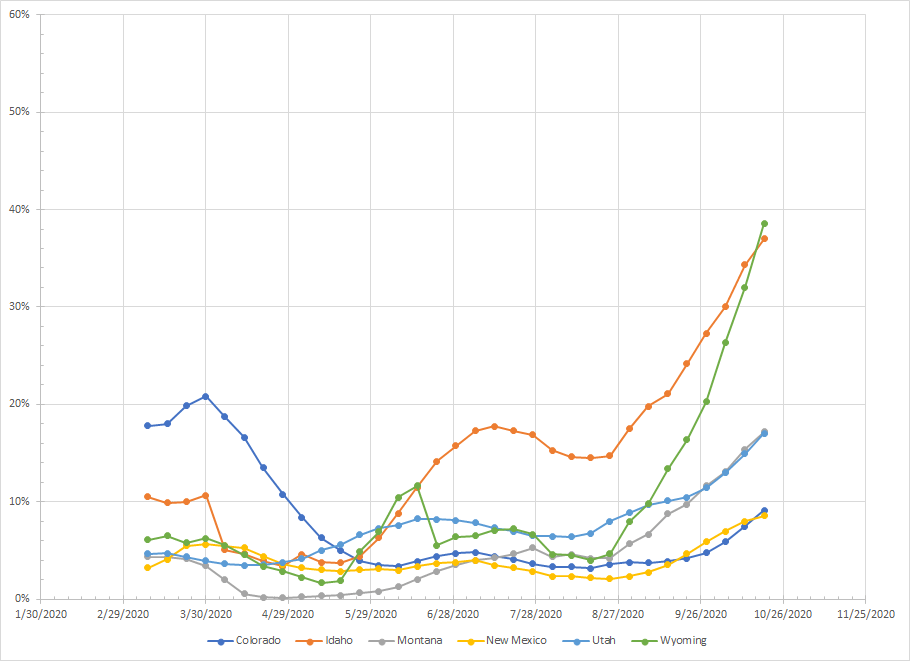
Wyoming and Idaho join the club with nearly 40% positives. Wyoming is especially scary looking while Idaho may have slowed down. All of the states in this group are still trending up but New Mexico looks to be in the best shape. Colorado and New Mexico are just below the 9.7% while the others are way above. Like the Upper Midwest, a region to be concerned about.
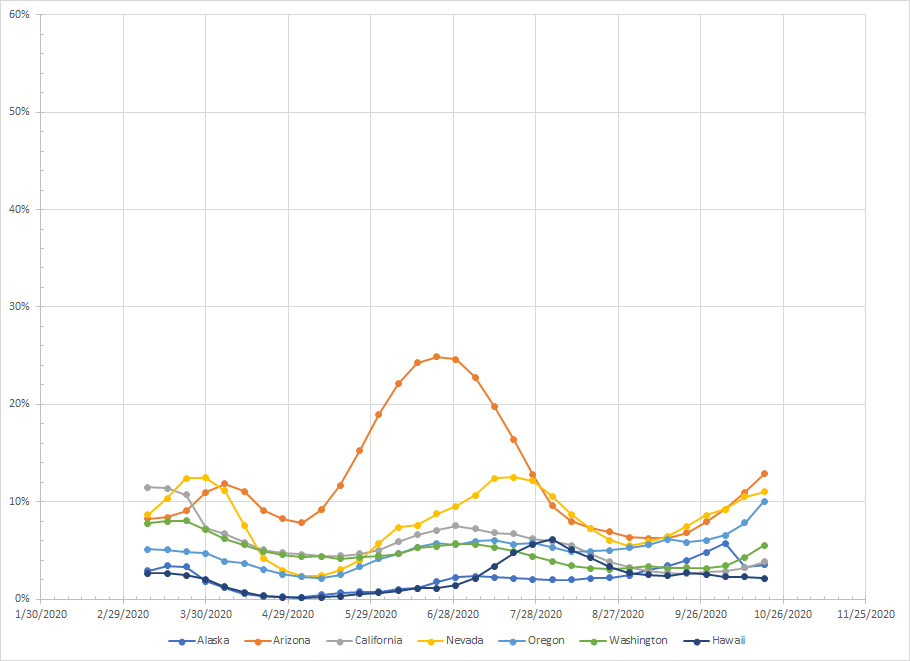
Here we have Alaska, Hawaii and California which are far below the 9.7% and flat to trending down. We see upward trends elsewhere but Arizona and Oregon are rising faster than the rest. Arizona, Oregon and Nevada are above the 9.7% but Arizona and Oregon are the ones to watch here. Maybe Oregon more so than Arizona since they really haven’t seen much of an impact until now.
The pattern over the last four weeks is that the percentage of positive results has jumped on either Tuesday or Wednesday. At this point, it is difficult to make any kind of prediction. I mean you could extend some of these lines and really scare yourself but things just don’t go up forever. And that’s about as optimistic as I can be right now.
