

I did take a couple of days away from this. Just didn’t feel like writing much. Just a quick update on the dance lesson. It did go better than expected. Learned some new choreography in the Quickstep and it did help to take my mind off the recent sucky stuff.
Before we get to the US, a couple of quick updates on the rest of the world. India has passed Brazil for second place in terms of total number of cases. Places like South Africa and Chile are definitely on the down side. Chile dropped out of the top 10 to be replaced by Argentina. Cases have flared in Europe so Spain came back into the top 10 as well and Iran dropped out.
Could India pass the US? It would take about 55 days for that to happen if both countries continued at their current pace. India is still on an upward track and there are a lot of people in India so it is certainly possible.
For fun, and using WHO data (which may be slightly more “official” than the various trackers I use for other purposes, I’ve got a plot of new cases per day in the US with the 10 day moving average. This is just to visualize where we were back in the summer and how far we’ve come down. Things have stalled a bit recently – wonder if it is the bolus of testing from schools and colleges opening again.

Moving back to one of my trackers, we did see an upturn in tests for the week ending yesterday. Back over 5 million for the first time in three weeks. But the number of positives continued going down making this the sixth consecutive week where the number of newly reported cases has dropped. The number of newly reported deaths also declined. And the overall percentage of positive tests was 5.5% for the week which is now the seventh consecutive week where it has gone down. I’m still convinced that we have a floor based on false positives and as long as we keep running 5 million tests, we may not see the overall number drop a whole lot more.
On to the state by state stuff. I know I promised I wouldn’t change things but I did. Classic for me – I just am never really happy with what I’ve got so I keep tinkering. I’ve kept the percentage of new cases relative to the peak and the number of current cases expressed per million people. The new thing is the percentage increase in the number of reported cases over the last week. I also adjusted the scales so that if you were theoretically able to get to 0 new cases, you’d have a score of 3. Which is not to say that a score of 3 means zero cases since there are still ranges for each.
Anyway, it means the scores have all changed and past stuff is no longer relevant. If I keep this scale, we can compare going forward but I make no promises.
As always, the states are grouped into sort of equal bins based on the score. Small differences in the scores aren’t really meaningful but just a way of ranking everything.
In the first group, we have New Jersey with 4 points. Then we have New York, Connecticut and Massachusetts with 5 points. New Hampshire with 6. Arizona with 7. Rhode Island and DC with 8 and Colorado, Vermont and Maine with 9.
We’ve covered New England and the NYC metro area before. Hard hit in the spring and it really looks like the virus has sort of burned itself out in these areas. Arizona was the first of the Sun Belt to see an increase in the summer but they peaked almost two months ago. The current number of cases per million is a the highest in this group but comparable to Rhode Island and DC. Colorado is an outlier. They never really seemed to have a defined high peak. Sort of spikes in mid April and mid July so there current case load is only about half of peak but actually lower than Massachusetts (per million) and not growing fast at all.
In the next group, we start with New Mexico with 10 points. Followed by Nevada, Delaware and Washington with 11. Then we have Florida, Pennsylvania, Oregon and Wyoming with 12. Finally, we have Louisiana, Texas, California and Maryland with 13.
We’ve got three places on the East Coast where the number of cases hasn’t dropped as much but are still in good shape. Then, we’ve got a lot of the states that were problematic in July (Nevada, Florida, Louisiana, Texas and California). Florida and Louisiana have the highest number of current cases are farther off peak value. And then we have the Pacific Northwest and a couple of Rocky Mountain states which all have a small number of current cases per million people.
It is kind of like we are moving from the coasts and southern border inland here.
Moving into the third group which would be right in the middle. To balance the groups, I made this one smaller so we start with Idaho and Michigan with 14 points. Then we have Utah with 15 followed by Mississippi, Georgia and Alaska with 16. Rounding out the group are South Carolina and Ohio with 17.
So we fill in more of the Rocky Mountain west with a couple of additional states. And we get more from the deep south – but places where things haven’t dropped off as quickly as the states in the group above. Michigan and Ohio are still close to peak but have relatively low numbers of current cases so they end up here. All places where it looks like the worst is over.
In the fourth group, we start with Nebraska, Wisconsin and Virginia with 18 points. They are followed by Tennessee, North Carolina, and Indiana with 19 points. Closing out the group are Alabama, Arkansas, Illinois and Minnesota with 20 points.
Alabama and Arkansas are the laggards in the Sun Belt (is Arkansas considered Sun Belt?). Both still have high current cases and haven’t dropped as far from peak. We get the mid Atlantic (Virginia and North Carolina) and Tennessee just to the west and pick up more of the mid west (Illinois, Indiana, Wisconsin and Minnesota). Plus Nebraska just because. As of yesterday, Minnesota was still at peak. Here’s a graph:
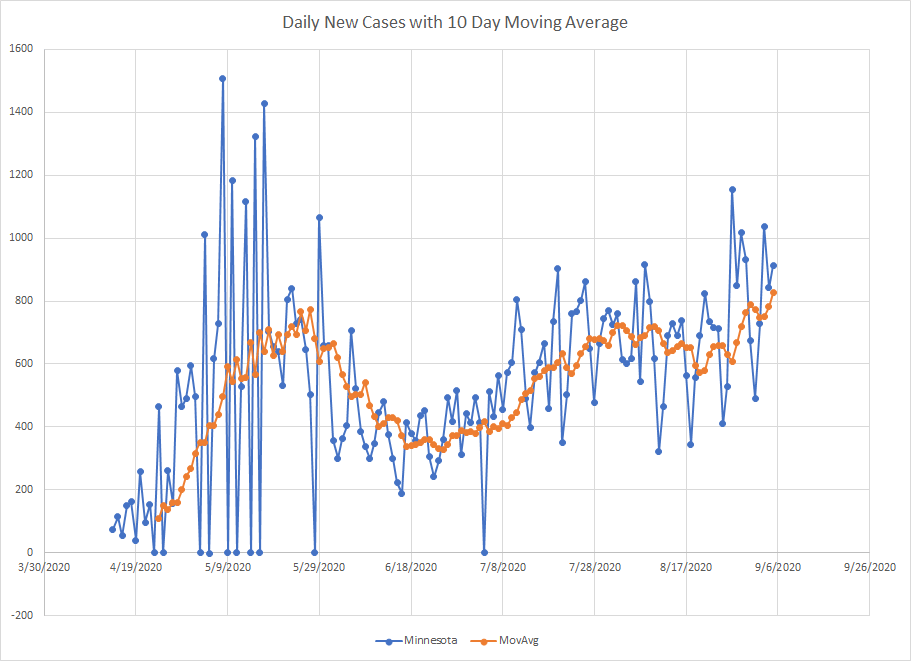
Lots of noise in the daily reporting which is why I use a moving average. Not a rapid increase like they had at the end of April but the trend is up and not down.
Now we come to the last group which starts with West Virginia with 21 points. They are followed by Oklahoma, Kansas, Montana and Kentucky with 22 points. Hawaii with 24 and Missouri and Iowa with 25 are next. Bringing up the rear are South Dakota with 27 and North Dakota with 28. Last week, I noted spikes in Iowa and South Dakota. They were confirmed this week. These might be the places where the ‘rona is making a last stand in the US. With the exception of Hawaii, we did kind of go from the outside in to the upper midwest with Kentucky and West Virginia tossed in.
Aside from Minnesota, we have four other states the currently sit at their peak. I’ve got graphs for all.
Here is Kentucky. They were spared in the spring so this is just the virus catching up. Like many states, they saw a big growth in cases through July but just have stayed at that peak value since then.

Next, we have Iowa. The average is going to drop once that one day with almost 1600 cases comes off. But the last two days are in the top five in terms of number of newly reported cases. They were kind of flat until mid August but have spiked up since then.

Next on the list is South Dakota. They’ve not approached the peak of 600+ back in last August but you can see that the cases for the last week are higher than the rest of the year. Interesting that other than some random spikes back in April and May, they’ve had a low number of cases. Again, could just be the virus doing what viruses do and eventually catching up. Growth looks exponential but the peak is exaggerating that a bit. When that comes off, it will look more like a flat line.

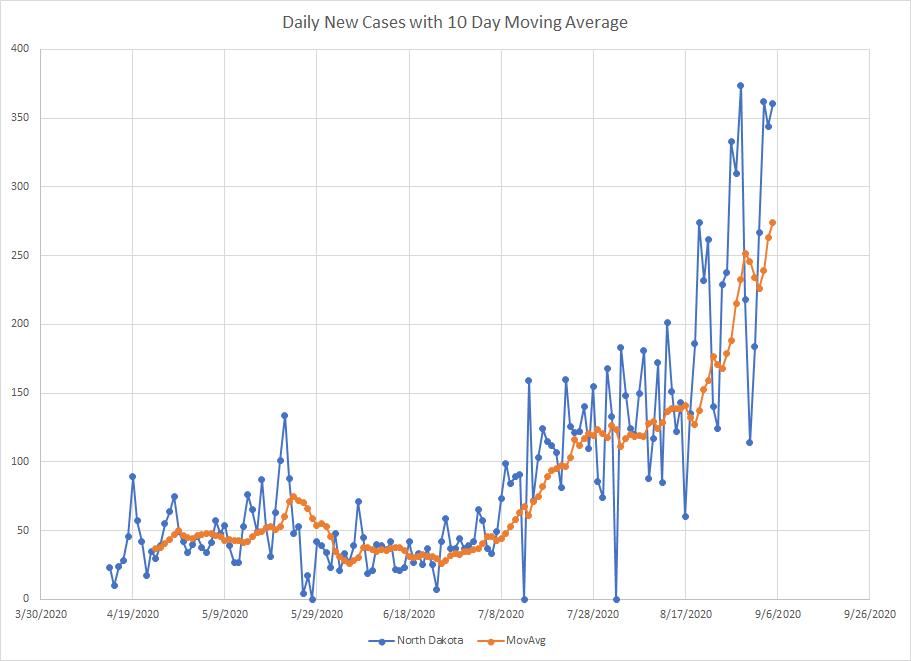
Lastly, we have North Dakota which has taken over from Hawaii as the state with the worst score. Like a lot of states, we get a great deal of daily noise. Things were flat until last August when cases started to shoot up. The last three days have clustered near the peak value so the trend looks like it is still increasing. I know my scores are somewhat arbitrary but, I’d look at this graph and it doesn’t look like a place where things are under control yet. I’d say they’ve earned the spot at the bottom of the list.
So there it is. Missouri is the largest state in this last group but it doesn’t really come close to Florida, Texas or California. The fact that there aren’t that many people in these states would suggest that we won’t see the number of cases rocket back up to where we were in July. Unless we see other places start to move in the wrong direction. It still feels like we are closer to the end than the beginning although we won’t know for sure until it gets cold.
