

From the news sources I sample, it appears that the fear over BA-5 is being ramped up. Some places are considering (or may have implemented) new mask mandates. Seriously, when does this end? The vaccines don’t eliminate spread and the virus continues to mutate so the crisis is never going to be over. I suspect that by now most people are sick of it so the mandates and such will be limited to a few places.
And from all I’ve read in these past two years, I’m totally convinced that masks do nothing to prevent or even slow the spread of these viruses. At this point, I now feel sorry for those who still slap them over their faces thinking they are getting some benefit. I suppose it may make them feel more secure but I’m not sure that’s a good thing.
Enough editorializing, lets look at the data. Over the last two weeks, we’ve had 788,772 and 743,945 newly reported cases. For eight weeks in a row, the number of newly reported cases has been between 690,000 and 790,000 so a very narrow range and alternating between increases and declines. As I’ll show later, the particular states that are driving it has changed as we move further into summer but the overall totals have been very consistent since mid May.
The CDC numbers continue to show a decline in the reported number of tests. The figure for last week was the lowest since early May of 2020 when testing wasn’t widely available. Someone suggested this is due to the wider available of home tests which maybe don’t get counted in the individual statistics. That only makes sense if physicians have stopped doing confirmatory tests if someone reports a positive home test. When I got COVID last year, the first thing they did was retest even though I told them I had tested positive on a home test. But I don’t know if that has changed.
The reality is that there is an impact to the case numbers based on tests and that may make them less valuable but I still think they can tell us something on a state level.
Before we get to the graphs, the data for North Carolina and Oklahoma are a bit suspect due to reporting gaps. So here’s the overall graph showing cases per million vs percentage change in cases.
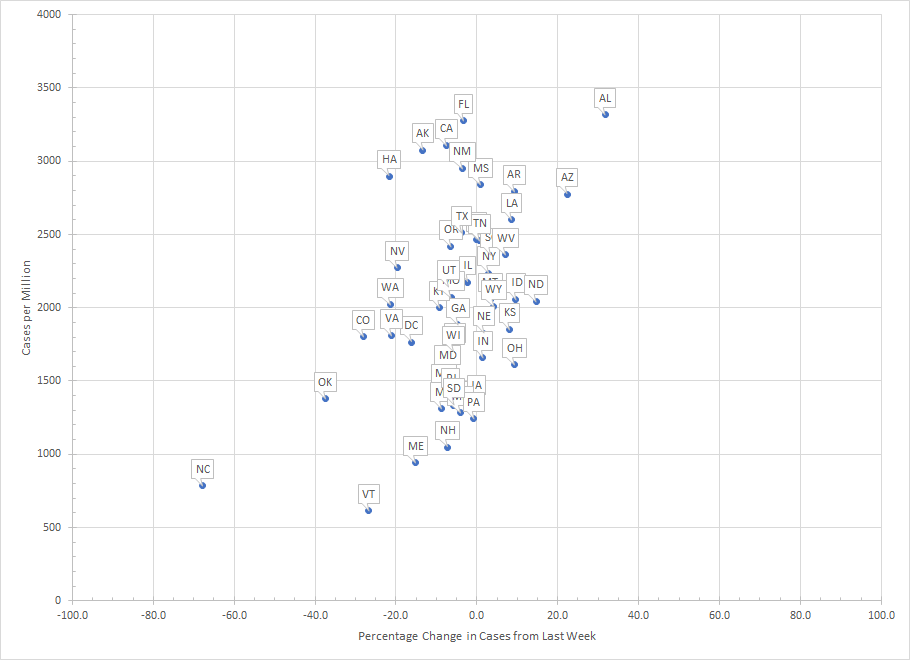
Cases continue to drop in Hawaii which is no longer the hot spot in the nation – that is now Alabama with the highest number of cases and relatively rapid growth. Arizona also saw a big jump but most of the states saw very small changes in cases from last week.
It is probably worth running through the region by region graphs. I’ve cleaned up the x-axis to make the dates more readable. In the Northeast, we do have a bit of divergence as cases in New York and New Jersey have been flat and not dropping like most of the other states. Pennsylvania is also flat but the number of cases there is similar to the other states.

The general pattern across all the states in this region is a slow decrease in the number of cases but remain above where they were at this time last year. We were seeing the beginning of another wave last year at this time but that is not the case now.

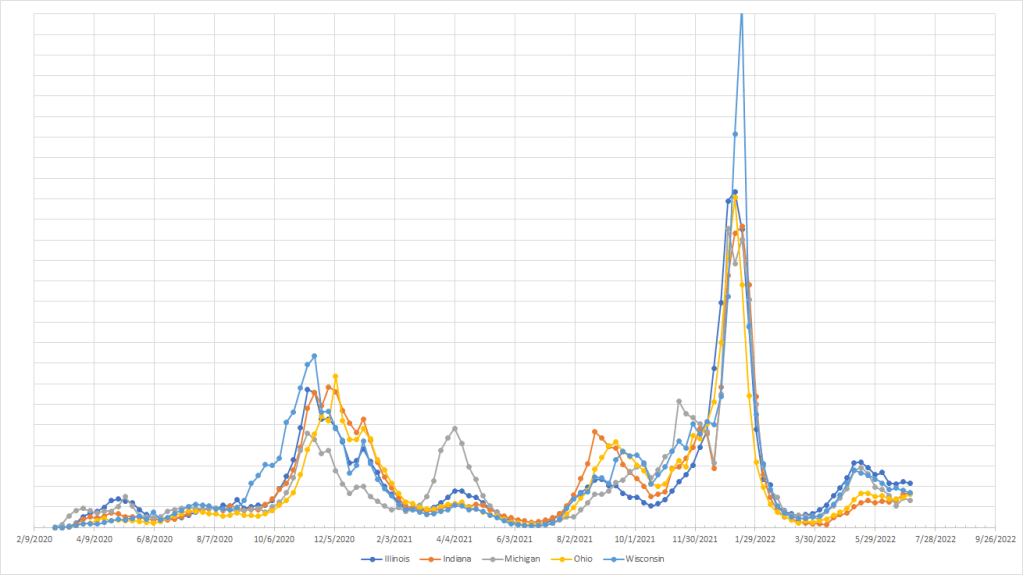
In the Midwest, we had a north/south split back in mid May but they’ve all converged except Illinois which remains a little higher. The pattern is essentially flat here. Last year at this time was the start of the late summer Delta wave but that is again not the case this year.
In these three states, the trends are flat to slightly increasing. Kentucky is a little lower than the other two but they are similar. Last year, cases had started to shoot up through July but we aren’t seeing anything close to that level of growth this year.

Florida has been flat for many weeks in a row and was just passed by Alabama last week. We are seeing cases rise here but, with the exception of Alabama, the growth rate is pretty slow. So just a small upward trend in cases. Last year, we were seeing the summer wave here which peaked in late August. Unless the growth rate suddenly explodes, it seems unlikely that we’ll see the same level of cases this year.

A couple of weeks ago, Minnesota had diverged from the other states in this region but cases have been dropping there while going up in the others and both North Dakota and Nebraska have passed Minnesota. North Dakota is seeing the fastest growth in this region and has the most cases but the rest of the states remain low when compared to the rest of the country.

Like the Southeast, this region is currently seeing cases rise with Arkansas and Louisiana being among the states with the fastest growth. As other regions have flattened or seen declines, Arkansas, Louisiana and Texas now rank among the states with the highest number of cases. Much of that may be seasonal as similar waves were observed in the last two summers. The growth rate in cases looks more like 2020 than 2021 and the peaks may fall somewhere between the two years.

On to the Rockies, where we have some divergence. Cases have been dropping in New Mexico and Colorado but are on the rise in Idaho and Montana. Wyoming has too much variability to really see a trend. New Mexico still has one of the highest number of cases in the country and remains the highest in this region but that will change if current trends hold. We did have a similar pattern last year where cases in Idaho, Montana and Wyoming peaked in the early fall at a much higher level than Colorado, Utah and New Mexico.

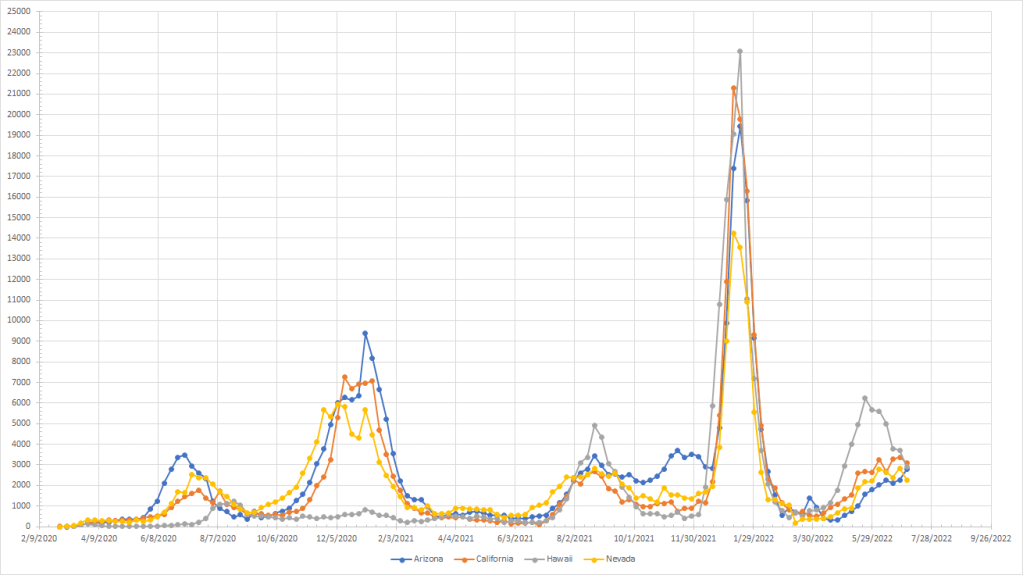
In this region, we continue to see cases drop in Hawaii and they below California in terms of cases per million. Arizona is the only state seeing cases go up – they’ve been flat to slightly down in Nevada and California. But Arizona, California and Hawaii still rank in the top ten for the most cases per million in the country. The trends this year look similar to last year although Hawaii peaked earlier and at a higher point than they did in the summer of 2021.
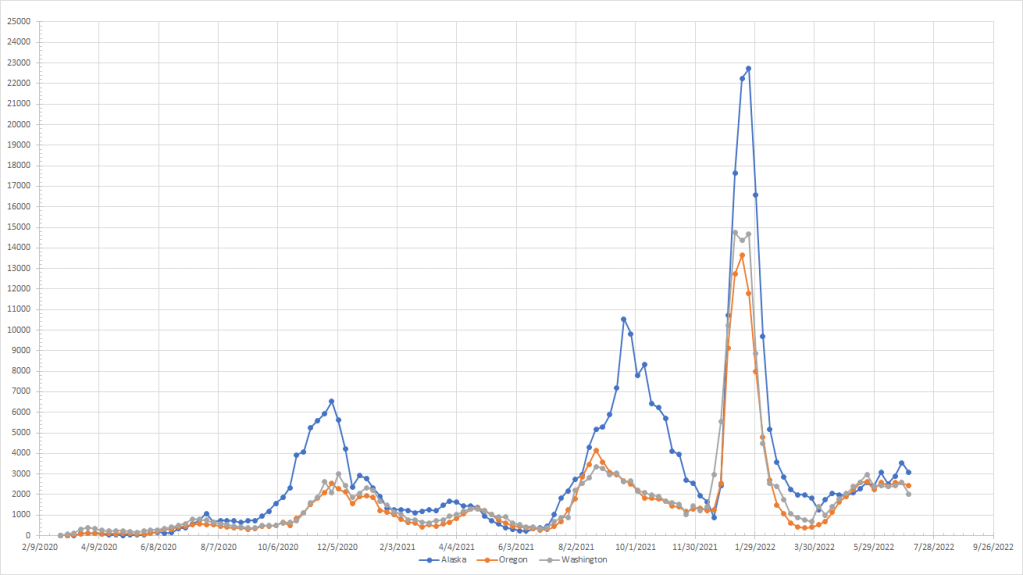
In the Pacific Northwest, cases are done from a month ago but still seem to be essentially flat. Washington did see a bigger drop last week but we’d need more data to confirm. Cases remain high in Alaska as they have for many weeks but Washington and Oregon no longer rank near the top ten. And the pattern is different from the summer of 2021 when all three saw cases rise from early July into August or September. Right now, Alaska doesn’t look like they are going to be anywhere near to the peak they saw in 2021.
The last graph is the year over year comparison. As we moved later into the summer of 2021, we started to see cases take off in a few states but all states still have a higher number of cases this year than they did at this time last year. The graph does show some seasonality as there is a correlation between the two years.

The ten states with the lowest number of cases this year were Vermont, North Carolina, Maine, New Hampshire, Pennsylvania, Minnesota, Michigan, Connecticut, South Dakota, and Iowa. Seven of those states (Vermont, Maine, New Hampshire, Pennsylvania, Minnesota, Connecticut and South Dakota) also were in the top ten for the lowest number of cases during this week last year.
The test states with the most cases last week were Alabama, Florida, California, Alaska, New Mexico, Hawaii, Mississippi, Arkansas, Arizona and Louisiana. Of those, Florida, Mississippi and Arkansas also were among the top ten states with the most cases during this week last year. And Arizona and Alabama ranked 11th and 12th last year.
Overall, we continue to see cases in a flat range but it is complicated by the decline in testing. The Northeast has moved to the region with the fewest cases (in general) and we see things picking up in the south.
