

I don’t watch a lot of news so what I get are mostly trends and impressions of what is “hot” from various web sites. It leads me to believe that COVID is ice cold and most people are basically done with it. The number of mask wearing holds outs continues to dwindle. In fact, I was in a store I frequent regularly and one of the workers had finally removed her mask. I couldn’t remember when the last time I saw her complete face was.
Yet the number of cases continues to rise but there is no detectable panic from sources that would have been shouting from everywhere if this had happened last year. If my impression is right, then this is a good thing because there was no way to eliminate this virus and we’d eventually have to just live with it. We aren’t there yet because the testing industry still makes way too much money to give up easily so we’ll still find cases and still count them.
If there is any good news in this week’s data, it is that a couple of the Northeastern states saw a drop in cases last week. There were all small drops and we don’t overreact to a single week but we need to see tops in those places to better understand when this wave may run its course.
For the week ending on May 15th, there were 640,116 newly reported cases. This was up 33% from last week so the rate of increase picked up which is why we can’t call a trend based on a single week. The 33% increase was actually the largest week over week increase since cases started going up in the first week of April.
But I continue to doubt whether looking at percentage increases (even for the entire country) is really valid anymore given the lack of daily data in most states. I mentioned DC and North Carolina last week because they had several days with no cases reported and they had big increases this week and some of that is filling in the gaps from the previous week. These data dumps do make it hard to really see trends because they can cause the percentage increase to fluctuate quite a bit.
The ten states with the highest number of reported cases per million last week were Rhode Island, DC, Massachusetts, Hawaii, Connecticut, New Jersey, Illinois, Maine, New York, Vermont and Wisconsin. So this continues to primarily be a Northeast thing although cases were up in almost every state.
The ten states with the lowest number of reported cases per million last week were Arkansas, Montana, Wyoming, South Dakota, Alabama, Oklahoma, Idaho, Louisiana, Texas and Arizona. A couple of clusters there so there continue to be geographic patterns.
Shown below is a comparison of this year to the same week last year. I had to expand the axis up to 5000 to get Rhode Island and DC on the graph. Alabama’s data from last year was an anomaly but they were among the five states that have lower totals this year. The others are Colorado, Wyoming, Montana, and Idaho.
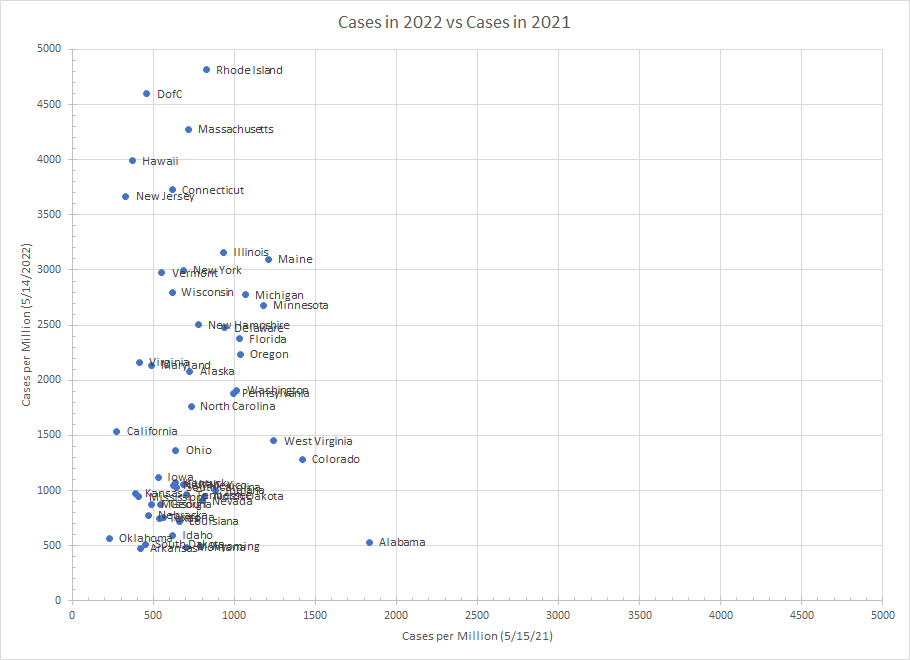
Last year, there were only 9 states that saw more than 1000 cases (per million) in the week with Alabama being the highest at 1830. This year, there were 30 states with more than 1000 cases (per million) reported in the week. And 22 of those 30 were higher than the 1830 peak from last year. Just a lot of numbers to illustrate how many more cases we had last week than at the same time last year.
But it is important to put these numbers in full context when we are coming off the big numbers in January of this year. So I’ll do the region by region graphs showing cases per million since this whole thing got started in 2020.
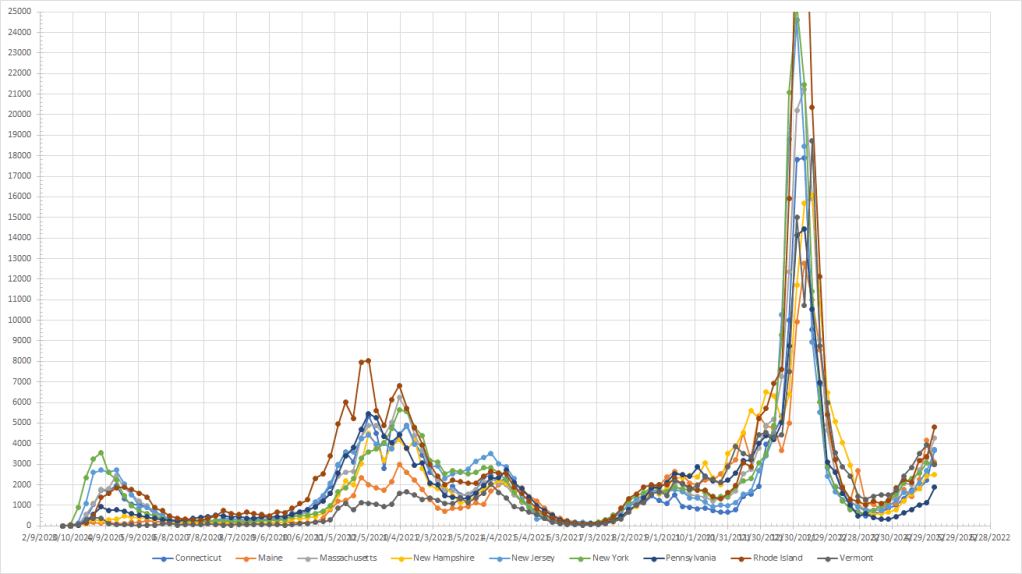
As I mentioned, a couple of states saw cases drop last week but until we can confirm that pattern, we can’t call a peak. I now realize the date axis is unreadable so you can’t really see last spring but it right about where the J in New Jersey is in the legend. We were clearly coming off the winter/spring peak and heading to the early summer low last year and that is not the case now.
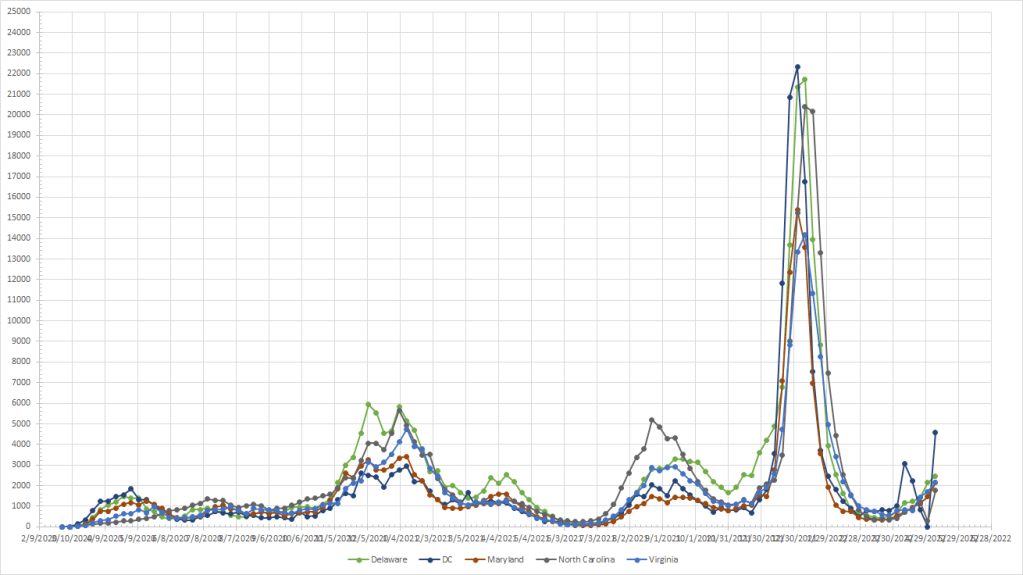
DC is the poster child for inconsistent reporting so you see the numbers bounce around making it hard to really determine an exact trend but cases are going up everywhere.
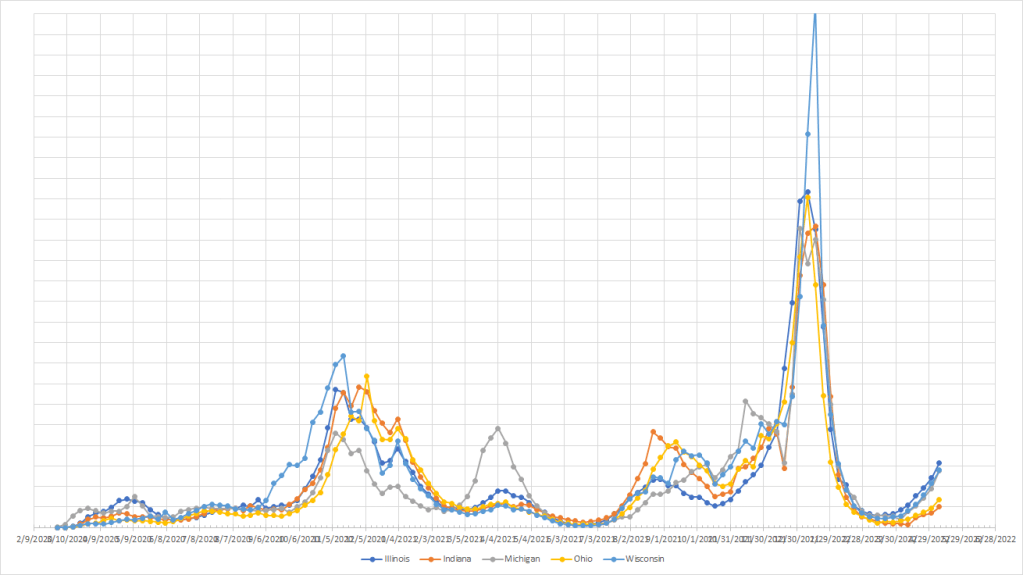
There is some separation between Indiana/Ohio and Illinois/Michigan/Wisconsin but all are going up. Other than Michigan, all the states here saw a small bump in April of last year and have gone over that level this year with cases still rising.

Cases here were basically flat in April of last year and then started to drop in May. While the rate of increase isn’t large, all three states are seeing cases rise now.

Florida has shown higher numbers than the rest of the states here since this started and that continues to be the case. But we are seeing the increases pick up slightly in the other states even though the overall numbers remain low. This is a region that typically has a summer wave starting in mid to late June so not sure how what is happening now will influence that.
Minnesota fits better with Illinois/Wisconsin/Michigan than it does with the other states in this group as it lead the way in terms of cases. Minnesota saw a small peak last April but has now gone beyond that total. Smaller increases in the other states where cases still remain relatively low.

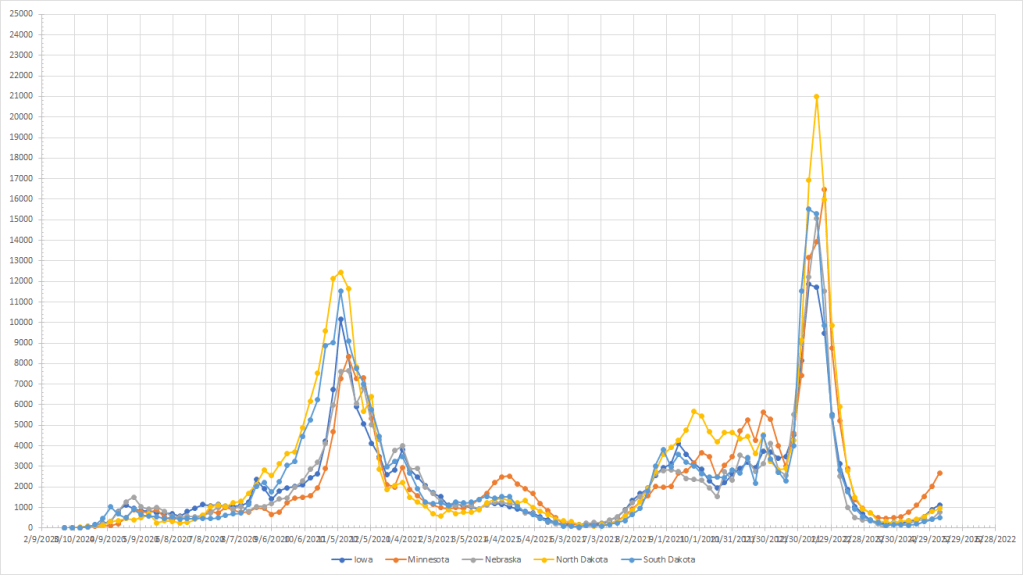
This region really isn’t participating yet. Yes, cases have ticked up slightly but the overall numbers remain low and the growth rate is really small compared to other places. Like the Southeast, several of these states saw a summer wave starting in late June of last year. So we’ll wait and see what happens.

Another region that really isn’t participating yet. Colorado saw a small bump in April of last year but did not see the same thing this year. Cases are up very slightly but remain at relatively low levels.
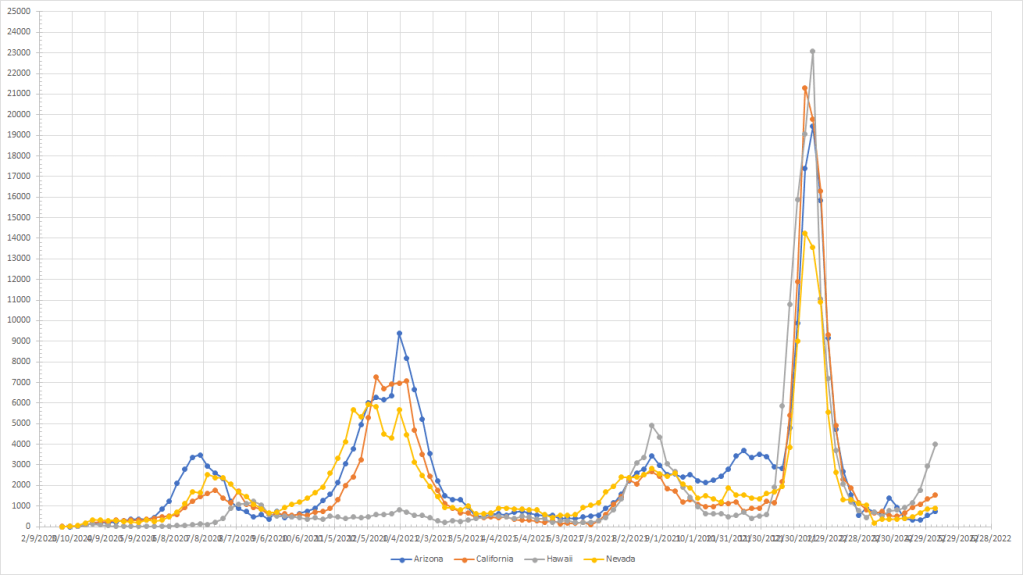
Hawaii is an interesting case. They really didn’t have much of a problem until last summer when they had the wave that peaked in late August. Whatever is happening now looks like it may go higher than the summer of 2021 wave. There are increases in all the states but Hawaii is the most dramatic.
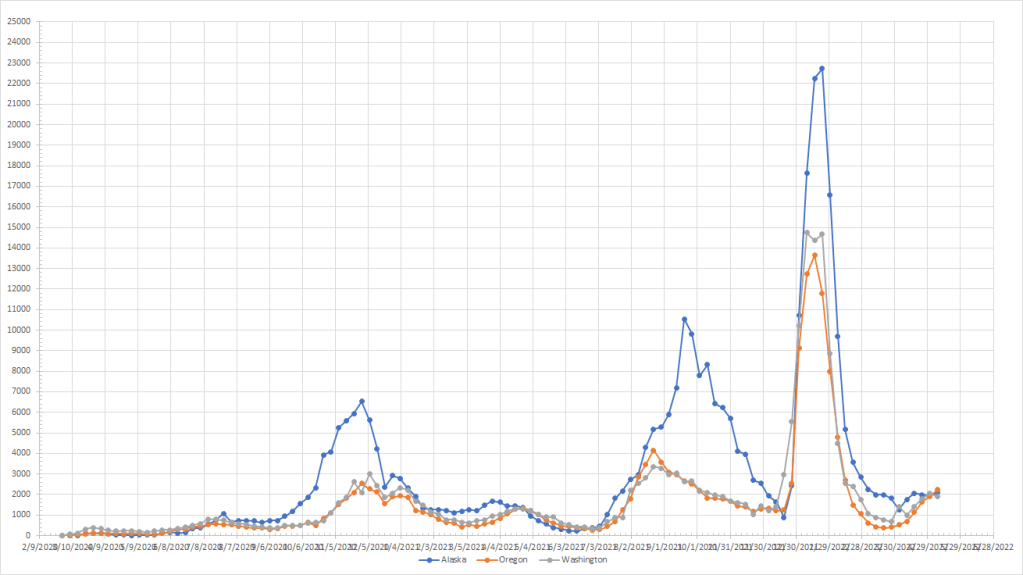
Alaska is also interesting as cases there have been flat for about eight weeks in a row. Washington saw a small drop in cases while Oregon saw a small increase but they both look like they want to hit some kind of plateau but we need more data to confirm. Even though Alaska is at a higher level than last year, the pattern is similar where they had a long stretch of basically constant cases before things started to drop. So Alaska might also be a place to watch to judge when we might see this pattern end in other places.
The bottom line is that we’ve reached mid May and cases still haven’t peaked yet. Just still slowly grinding upward.
