

Except this is a race you don’t really want to lead. We continue to have the same general pattern with cases going up and more states seeing increases. But the highest counts remain primarily in the Northeast. And while the numbers are up, they are still remain relatively low in most states.
But where are we going? One thing that makes this more challenging is that there are many states that report once a week and so we aren’t getting daily updates which makes seeing the trends harder. The pattern in the Northeast is a little more worrying than it was last week but I don’t think there is enough data to suggest we are about to see things start to take off.
So that’s the tag line – more concern than last week but still not panic time.
For the week ending on April 17th, there were 247,690 newly reported cases. This was up 21% from the week before and a 21% increase is bigger than anything we saw last spring and is the low end of what we’ve seen in previous waves. This was the highest number of new cases in six weeks but still below this time last year where the number of new cases was 480,040.
This was right around the peak last year and then cases dropped rapidly. Last year, we went from the 480,040 to 378,118 and it kept dropping all the way through May. Hopefully, history will repeat.
Here is the graph showing cases per million against weekly change. A few places aren’t on the graph. DC had a big spike and I’m always leery of one time changes. Wyoming actually reported negative COVID cases for the week which is a correction of previous data so they fall off the chart.
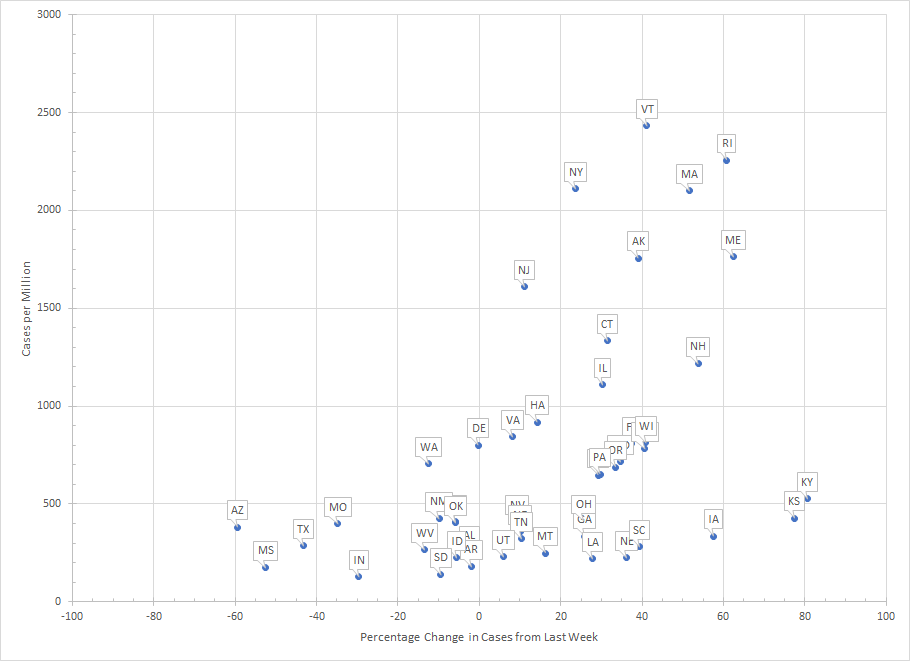
Cases were up in 34 states and DC which continues the pattern of more and more states showing weekly increases. But only ten states (well nine plus DC) had more than 1000 cases per million which is an arbitrary line but below 1000 is low compared to historic trends. So places like Kansas and Kentucky had huge increases but a small number of cases and are less of a concern than the places to the upper right on the graph that had smaller increases.
The ten that were above the 1000 cases per million were DC, Vermont, Rhode Island, New York, Massachusetts, Maine, Alaska, New Jersey, Connecticut, New Hampshire and Illinois. Outside of Alaska and Illinois, it is all the Northeast. Cases just won’t seem to come down in Alaska as they’ve been above 1000 since the middle of July (not counting the week of Christmas which was artificially low).
The regional graphs are starting to get interesting but I’m going to hold off on taking up more space until we see how this trend plays out. If we get a couple more weeks of cases going up, then it might be worth showing them.
One last little note on the Northeast. Several of those states hit minimums in mid March and have now had increasing cases for five weeks in a row. Six to eight weeks is roughly a “typical” wave which might also mean they aren’t going to really break out.
The main point is that we did see a bigger increase in cases last week but, outside of the Northeast, cases remain low.
