

This is going to be a short post and, if I do additional posts, they’ll likely be in this format. The US numbers continue to fall but they have a long way to fall to get back to pre-Omicron levels so I’d expect this trend to continue through March. We did have an unusual bump in March/April in a few places with Michigan having the largest wave. If I start to see the current trends reversing, then it would be worth discussing. If things just continue to fall, that is good news but when all the states are trending in the right direction, the rankings are less useful as they really just mark where a state is the downtrend.
For the week ending on February 6th, there were 2,039,046 newly reported cases in the US. This was down almost 42% from last week and down 63% from the peak four weeks ago. For reference, this is still higher than any week during the big peak last winter so there is still a long way to drop.
All of the states saw cases drop last week. The smallest drop was 6% in Mississippi and the largest was 62% in Pennsylvania.
I’ll just end with one graph showing cases per million and percentage change from last week. I’ve kept the scales the same as they were last week but you’ll see that all the states are on the left side of the graph.
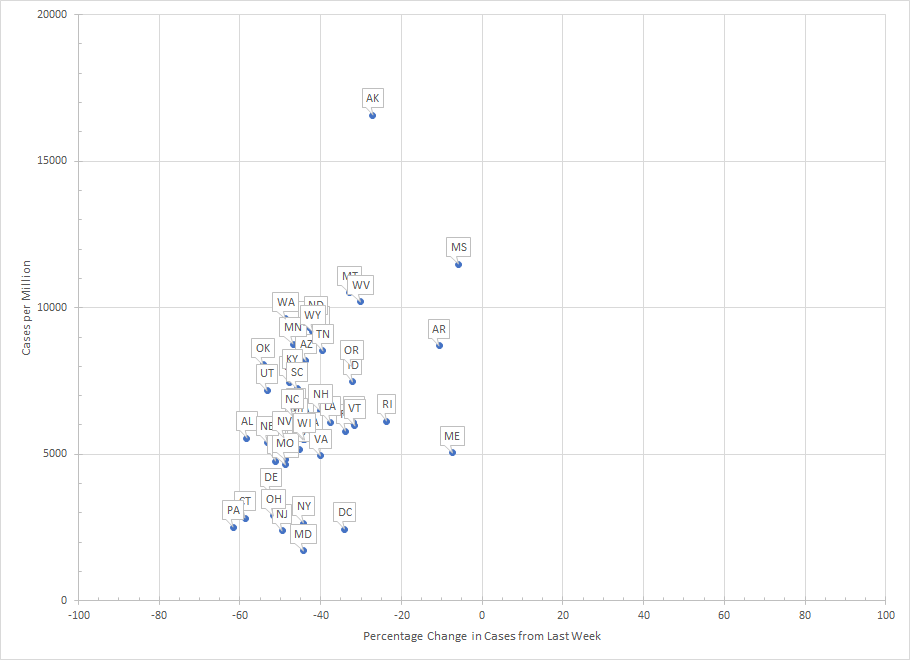
Just for some perspective, last year at this time, the highest number of cases per million in any state was 4402. You can see that there are just a handful of states below that figure now and the majority are between 5000 and 10000. Omicron had a much higher prevalence than other variants and, even though the numbers are dropping, they are still high compared to past history. Really the only question is how long it takes for the numbers to get back to more “normal” levels.
Still the takeaway is that cases are falling everywhere. This continues to signal that the Omicron wave is receding.
