

Yesterday was Halloween so it is probably a good time to take a world view of that scary virus. I think the last time I did this was in the summer and things were calm in Europe and the Americas and on the rise elsewhere. Things have changed. As a reminder, all data come from the WHO and I use their geographic groupings which are based on their regional offices and not the actual continents.
This is all looking at the change in total cases from September to October. It is an arbitrary measure since the trends don’t follow the calendar but it is how we tend to think about time.
So here is a table showing the change in cases and deaths between October and September. Apologize for the generic look. Maybe someday I’ll invest some time in figuring out how to pretty it up a little more. Worldwide, cases dropped 19% but it was clearly not evenly distributed over the globe. Europe saw big increases in both while everywhere else saw declines.
| Cases | Deaths | |
| Europe | 35.9 | 37.7 |
| Americas | -38.0 | -19.4 |
| SE Asia | -44.3 | -47.4 |
| Eastern Med | -48.1 | -47.1 |
| Western Pacific | -50.2 | -47.3 |
| Africa | -69.2 | -61.1 |
| World | -19.1 | -15.5 |
When we break down the regions, we’ll see that even within a region, there were places that saw increases and places that saw decreases but Europe seems to be the current “hot spot”.
We can even narrow it further since it really centers on Eastern Europe. Of the five countries with the largest increase in cases, four border each other – Poland, Czech Republic, Slovakia and Hungary. Latvia and Ukraine make the top 10 so the biggest surge is in that part of Europe.
Having said that, it is still useful to look at the graphs to put things in context.
Here is Poland which had 18401 cases in September and 118176 in October or an increase of 542%. Still, it is worth noting that at this time last year, the daily average of cases was twice as high. Whether this fall/winter waves hits those peaks remains to be seen.

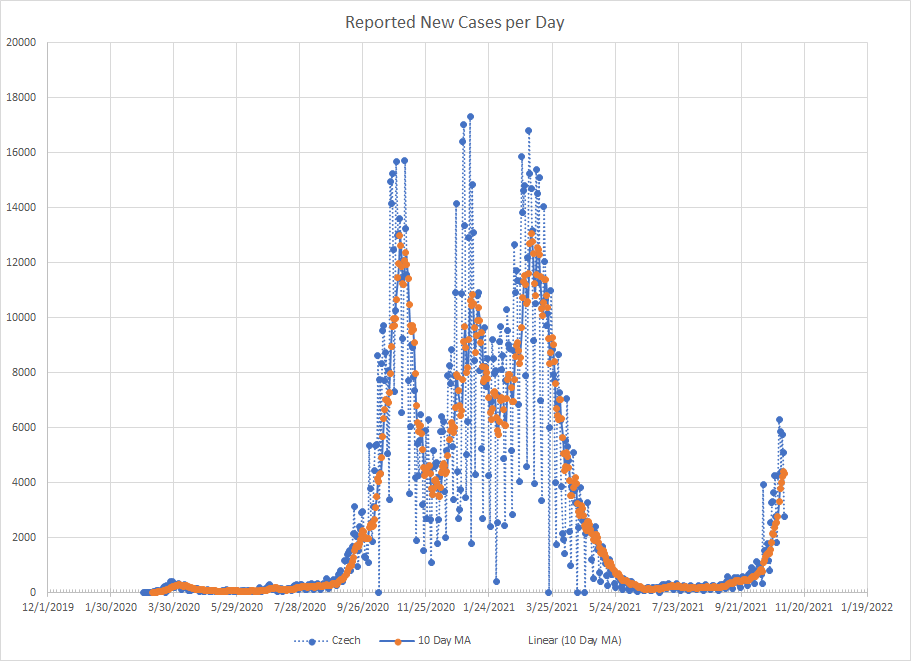
Next up is the Czech Republic which also saw an increase of more than 500% with cases going from 12302 in September to 73996 in October. Again, like Poland, we saw a similar increase at about this same time last year. And, also like Poland, the daily average number of cases was substantially higher at this time last year.
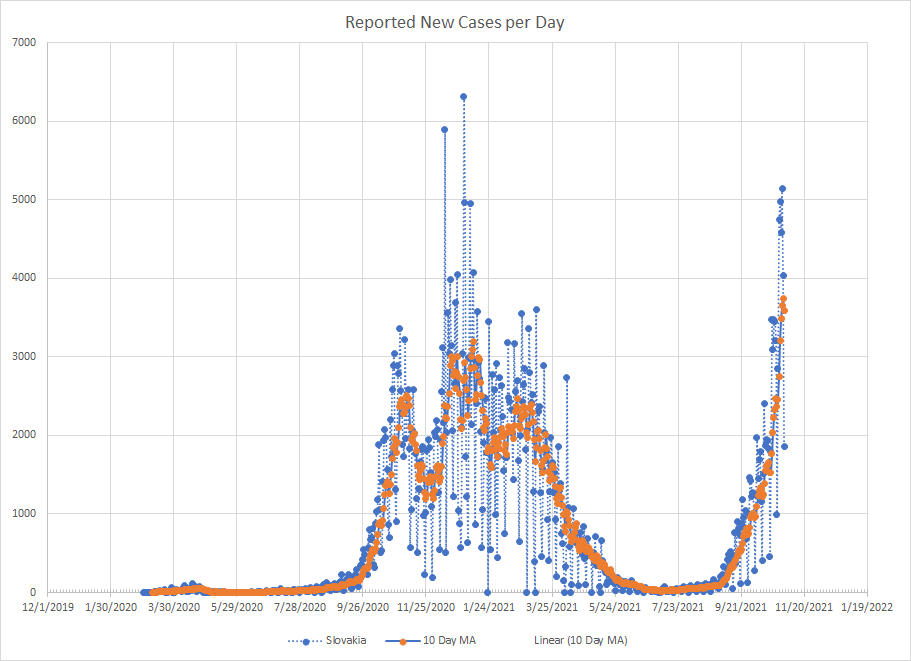
Coming in fourth was Slovakia which had a total of 17586 cases in September and 71266 in October for an increase of 305%. But we have a much different story than the other two countries discussed above. Slovakia has blown past the peak they saw last year and currently sits at a new high for average number of cases. And some of the recent days have been among the highest in terms of new daily cases. For what its worth, Slovakia does lag behind the other two in terms of percentage vaccinated (42% vs 52% for Poland and 57% for Czechia).
Ranking fifth is Hungary which went from 10368 cases in September to 40714 cases in October. One issue with the recent data from Hungary is that their reporting is spotty. The big spike you see at the end is the sum of a few days. They are actually on par with where they were at this time last year and had the highest percentage (59%) of people vaccinated.

Ranking third on the list was Papua New Guinea which went from 2129 cases in September to 9494 in October for an increase of 345%. This is similar to other Asian countries that were essentially untouched by COVID is 2020 and then started to see cases this year. Not sure how accurate the vaccination data is from the site I’m using but it looks like very little of the population has been vaccinated. They just recently hit a new high for average cases but it looks like things may be settling down there.

Two other countries of interest are Singapore where almost 80% of the people are vaccinated and New Zealand which just recently gave up on their policy of zero Covid. In New Zealand, over 60% of the population is vaccinated but they started their program later than the countries in Europe – it looks like the biggest push was in August and September.
Both places make the top 10. Singapore ranked sixth going from 26584 cases in September to 101168 cases in October. Covid had essentially disappeared there from September of last year through July of this year. In headlines, the recent surge is called “unusual” and Singapore was often described as having been a model in these stories where they also point out the high vaccination rate. After almost two years of looking at this data, it just seems like the virus eventually shows up everywhere and calling anything a model when they are in a low point is often proved to be very premature.

New Zealand has basically been closed to the outside world since this started. The actual number of cases remains low but they went from 704 in September to 2151 in October. The last couple of days have been the highest yet and remain way above the average suggesting that we can expect continued increases. It just kind of reinforces the point that controlling a very contagious respiratory disease is difficult and that eventually the virus just finds a way.

Finally, two graphs from places where COVID disappeared in October.
One was Japan which saw cases fall from 230399 in September to 22974 in October. Not sure what to make of that spike at the end – could be a glitch in the data. Cases in Japan actually peaked at the end of August and were dropping all though the period but they’ve crashed to very low levels. According to the data, over 70% of the people are vaccinated. But I found a story talking about how Japan “smashed” its latest COVID wave but the experts are “puzzled” as to how it was done. At this point, I’m not sure there are any experts. I can’t explain the “why” but the consistent pattern is these waves that last 6-10 weeks and then peak and start to drop. Maybe the virus just responds to its own pattern no matter what we do. Maybe all our human arrogance in thinking we can “control” it is just a fantasy.

The last graph is of South Africa which saw cases drop from 143129 in September to 20892 in October. South Africa lags way behind in vaccination with only about 20% of the population vaccinated. The wave wasn’t as neat as last year but the general pattern is the same. In the WHO Africa region, South Africa accounts for almost 50% of the cases and almost 60% of the deaths. I don’t have the figures but I know they wouldn’t make up 50% of the population. The WHO does put many of the countries above the Sahara in another region but South Africa still stands out as the hardest hit country. To date, I don’t think anyone really has a reason as to why this would be true.

The one trend is that as Europe enters winter, cases are picking up in certain places. Other than that, there remains some randomness in other places. Cases are mostly down but not universally outside of Europe.
