

The pattern we’ve seen throughout October continues with cases dropping in most places and the biggest drops happening in the South. Before we start, there is an important note about the data from this week. There are many states that don’t report numbers on the weekend. I believe the CDC had been taking Monday results and applying them equally across the weekend to fill in the missing numbers. In this latest data set, they did not do this.
I don’t know if they plan to do this at a later time or if this is now a shift in how things are going to be reported. They make changes to the data all the time so I go in and sweep the file each time I put these graphs together so they reflect the most accurate data I can get. But with several states now showing 0 cases for Saturday and Sunday, that overstates the decline that we’ve seen. And it could create situations where we see upward spikes next week because the weekend totals are now rolled into Monday.
For the week ending on October 24th, there were 433,668 newly reported positive cases. This was a 22% drop from the week before and part of that drop is the lack of weekend data for most states. But the missing weekend data wouldn’t be enough to reverse the trend so this is now the seventh week in a row of declining cases. The percentage of results that were positive was 5.6% which was unchanged from last week.
One interesting note is that I’ve been looking at seven day totals compared to the same period last year and the total for 2021 at this point in October is less than the total we had in 2020. That is the first time the 2021 total has been less than the 2020 total since the wave started. Last year, at this time, the fall wave was in full swing in most places and we saw cases continue to rise through the end of the year.
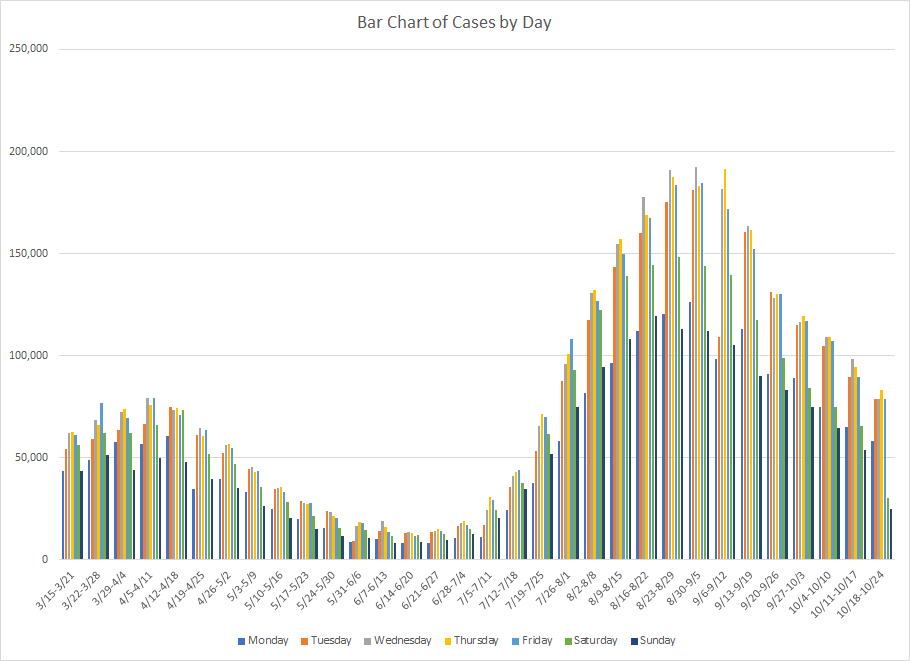
Here’s the bar chart of daily cases back to March. If you look closely enough, you can see that the lines for Saturday and Sunday in this last week are significantly lower than the week before but every day this week was lower than the week before. So the change in reporting had some impact but wouldn’t change the overall trend. We continue to see cases dropping but are still significantly higher than the pre-wave numbers from early June.
I applied my own scale again to the states which is just a combination of the rate of change and the actual case rate.
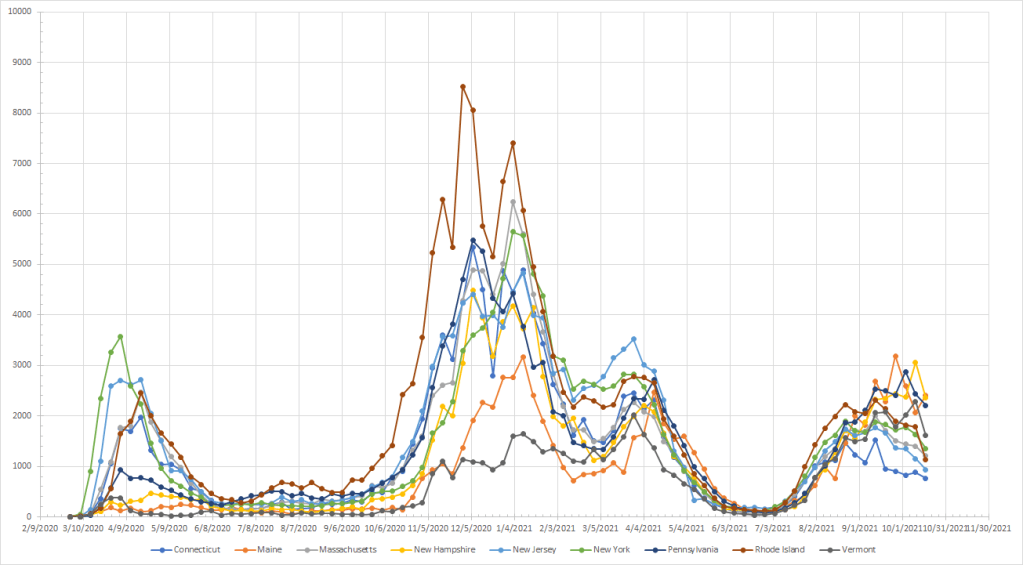
Ranked from best to worst, the states in the Northeast are New Jersey (12), Connecticut (16), Rhode Island (19), Massachusetts (25), New York (30), Vermont (34), Pennsylvania (38), New Hampshire (43) and Maine (46). Relative to the rest of the country, only Rhode Island and New Jersey saw big drops in cases over the month. But Connecticut, New Jersey, Rhode Island and Massachusetts all rank in the top 20 for lowest number of cases per million. Maine and New Hampshire saw small increases over the month and both rank relatively high in terms of cases per million and they stand out as the worst in this region.
Four of the five states here rank in the top half. The entire region is DC (6), Maryland (14), Virginia (17), North Carolina (23) and Delaware (36). Cases are falling in Delaware but they lag behind the rest of the region and have the highest number of cases. DC and Maryland rank in the top 10 for the lowest number of cases (remembering the caveat about the weekend reporting change). Overall though, the region is certainly trending in the right direction.

The five states here ranked from best to worst are Indiana (20), Illinois (22), Wisconsin (27), Ohio (29) and Michigan (47). So most of the states are middle of the pack. Michigan is the outlier. Cases did drop last week but we’d need additional data to confirm that they did hit a peak. Cases are declining in the rest of the states. In contrast to the Northeast, you generally have bigger drops but higher number of cases. Still, compared to last year, the region is doing well.

The three states here span a wide range. Tennessee (5) is near the top while Kentucky (18) still ranks in the top half. The situation is improving in West Virginia (31) but they continue to have a high number of cases even though the number is clearly going down. Noted last week but all three states hit a highest peak this year than they did last year which is not what we saw in the other regions discussed above.

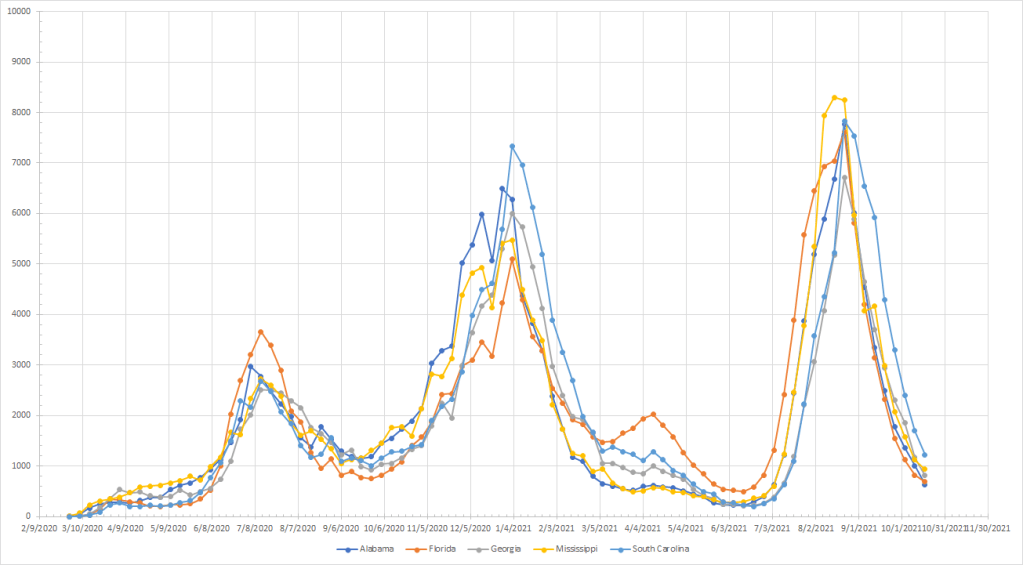
All five states here rank in the top 10 – Alabama (1), Georgia (3), Florida (4), Mississippi (8) and South Carolina (9). They all have low numbers of cases relative to the rest of the country and were still seeing big drops over the month. They are getting close to pre-wave levels and it does look like the rate of change is slowing as they approach the bottom. Like last week, clearly the best region in the country.
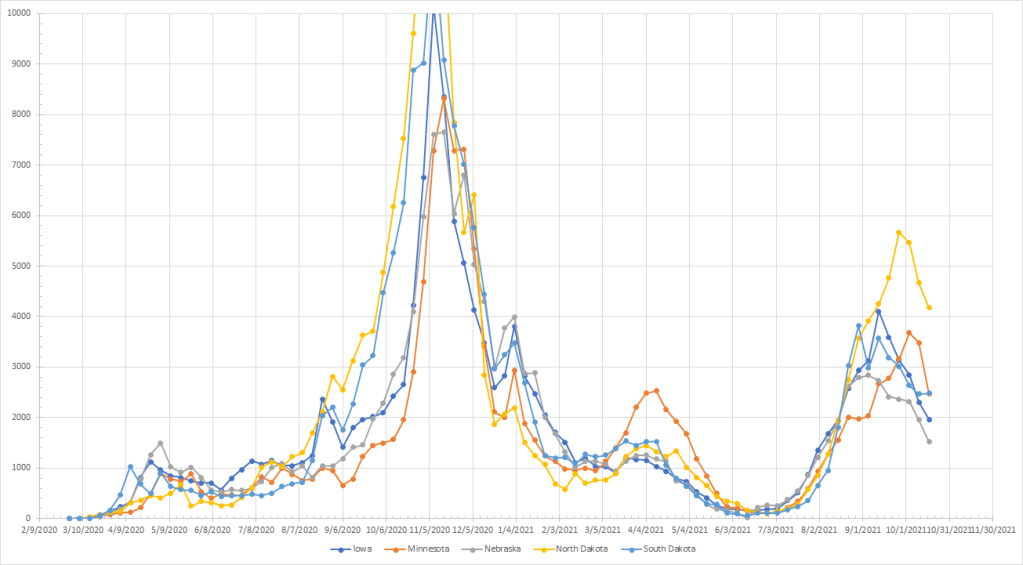
Other than Iowa (24), the rest of the states rank in the bottom half – Nebraska (28), South Dakota (39), Minnesota (44) and North Dakota (45). While the trends are going in the right direction, Minnesota, South Dakota and North Dakota have some of the highest case rates in the country. But, like the Midwest, compare this year to last year. At this time last year, cases were still rising and headed towards peaks well above what we’ve seen this year. If cases continue to go down, then that would be a huge improvement over last year.
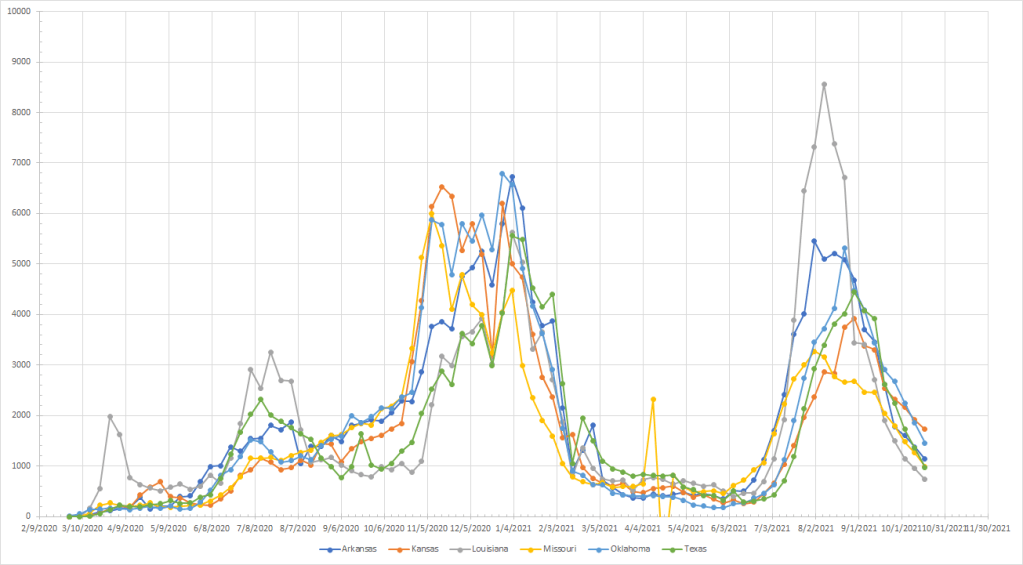
Other than Kansas (32), the rest of the states rank in the top half – Louisiana (7), Texas (10), Missouri (11), Arkansas (13) and Oklahoma (21). Louisiana is more like the rest of the deep south than this group and looks to be nearing a bottom after hitting a peak well above last year. The rate of decline is slowest in Kansas but all the states are certainly trending in the right direction.
The worst region in the US as all states rank in the bottom 10 – Wyoming (41), New Mexico (42), Utah (48), Montana (49), Colorado (50) and Idaho (51). Colorado and New Mexico are the best in terms of cases but both saw increases over the month. Wyoming had the biggest decrease but has one of the highest case rate. The good news is that we aren’t seeing the same type of growth we saw last year, and, like other regions in the north, the peaks this year are not as high as they were last year.

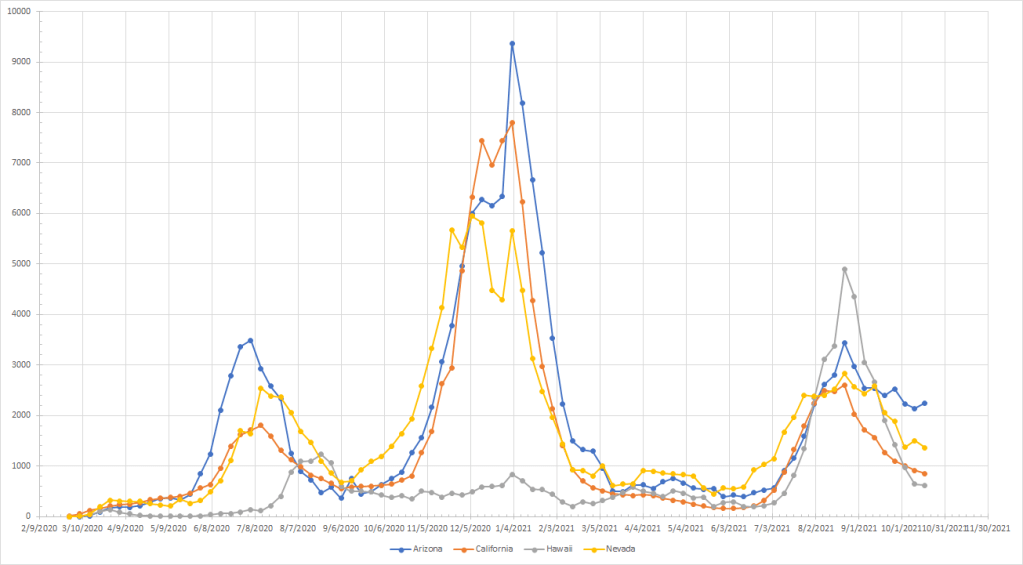
The four states here are Hawaii (2), California (15), Nevada (26) and Arizona (40). While cases are dropping in Arizona, the rate is slow and the case number remains high. We see some slowing in California as they approach a bottom. Other than Hawaii, the peak totals for this year are lower than last winter although last year the peaks were much later in the year.
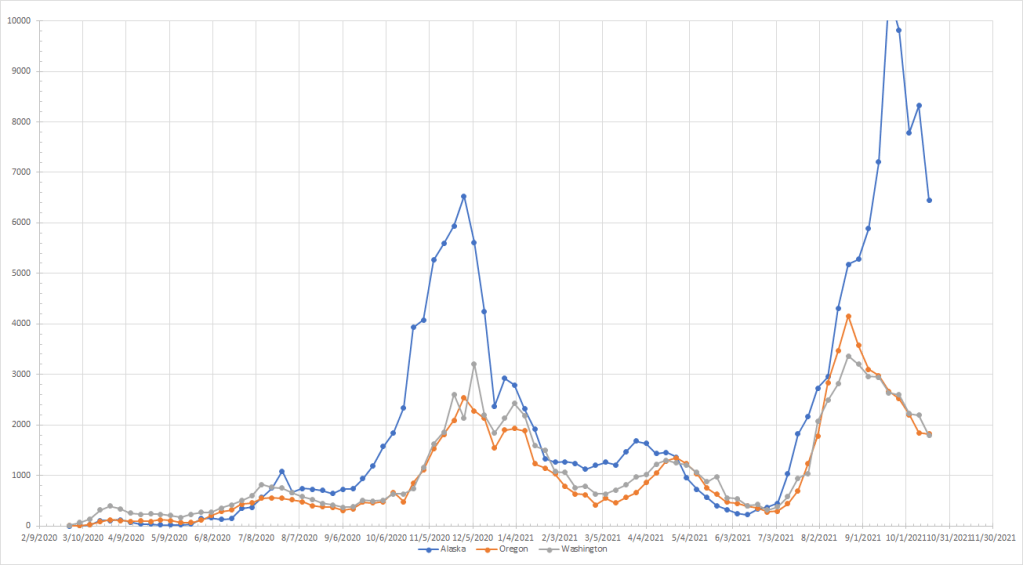
The three states here are all in the bottom half – Washington (33), Oregon (35) and Alaska (37). Alaska has the highest rate of cases but they’ve come down quite a bit from their peak. Cases continue to drop in Oregon and Washington but at a slower pace relative the rest of the country and cases remain relatively high. Alaska is the one northern state where the peak this year was way above their peak from last year but Oregon and Washington also set new highs this year. They are all trending in the right direction at this point.
In general, the summer wave hit the South hardest with cases hitting new peaks and drawing all the attention. Now, after cases have been falling for many weeks, they have case levels approaching pre-wave levels. Much of the north currently has not seen the peaks that were observed last year but those peaks occurred much later in the year. Last year at this time, cases were going up in most states. This year, they continue to go down but remain at elevated in most places.
Still too early for me to be overly optimistic but we just aren’t yet seeing any real evidence that these trends are suddenly going to turn around and start climbing again even as we get deeper into fall.
