

The WHO just updated their data and since today is the last day of August, we can look and see where the hot spots are. Actually, there aren’t a lot of places seeing real explosive growth right now. There were lots of places that saw big jumps in the numbers during August but it also looks like a lot of those places hit a peak in August and are now seeing cases drop.
This first table is the percentage increase in total cases and total deaths over the month of August. The regions are from the WHO and don’t map to continents. For the month, total cases increased by 10% while deaths were only up by 7%. The Western Pacific region saw the biggest growth in both. I’ll point out when I get there but many places in this region weren’t hard hit early on and have just now started to see cases surging. The actual numbers here (and in Africa) remain smaller than the other regions though.
| Cases | Deaths | |
| Western Pacific | 46.5 | 39.3 |
| Eastern Mediterranean | 16.5 | 13.1 |
| African | 14.4 | 15.8 |
| Americas | 8.6 | 4.7 |
| European | 8.6 | 4.2 |
| SE Asia | 7.8 | 13.7 |
| World | 10.0 | 7.1 |
Europe and the Americas look very similar in terms of both case growth and death growth. Since the Americas includes North and South America, this isn’t just a seasonality effect. In terms of both cases and deaths, this regions rank first (Americas) and second (Europe). And the Americas would rank first in cases and deaths if I used actual numbers and not a percentage but the percentage speaks more to how fast things are growing which seems more useful.
For this next section, I’m looking at the month over month change – comparing August numbers to July numbers. Totals will always increase but looking at one month vs another we can see where things were actually falling. Another note is that I only have this level of detail for places with more than 5000 total cases. So my counts don’t include all places in a WHO region – just the ones I’ve got full data for.
In the Africa region, I’ve got data from 45 places. Cases increased in August in 27 of them and decreased in 18. In fourteen places, the number of cases in August were more than double the number of cases in July. If I cut the list down to places with a “large” number of cases, the four that stand out are Ethiopia, Nigeria, Eswatini and Ghana.
Nigeria and Ghana are just north of the Equator and border on the Atlantic Ocean. In between them are Togo and Benin which also saw cases more than double. Cote D’Ivoire borders Ghana on the other side and also saw cases more than double. So there is some geographic pattern and that section along the Atlantic just north of the Equator seemed to see big increase in July.
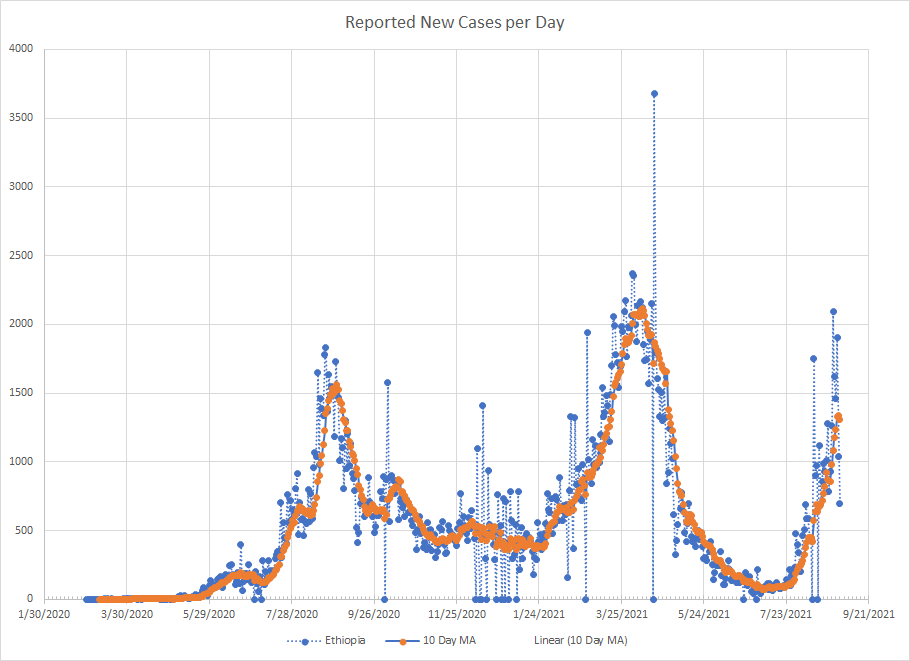

Note that things appear to have peaked here with the moving average line stalling out.

Eswatini sits in Southern Africa and most of the places there had already peaked an saw declines in August. Eswatini just seemed to be a bit behind but this current wave is clearly over and cases are headed down.

Data gets muddy here because of gaps in reporting which leads to a bunch of days with 0 and several days with a large number of cases. The pattern this summer looks a lot like last year although the peak average seems to be a bit smaller. Again, it looks as if cases are no longer going up.
In the Americas region, I’ve got data from 36 places. Cases were up in 21 and down in 15.
There were nine places where cases more than doubled. The US makes that list but I do a more detailed look at that data so I won’t repeat it. Puerto Rico and the US Virgin Islands also make this list along with the islands of Saint Lucia, Guadeloupe Aruba and Jamaica along with Belize from Central America. The last country is Canada and I’ll show that graph. None of the big increases were in South America and most of South America saw cases fall in August.

Last year, Canada had a fall wave that started in mid September. So late summer was flat last year making this increase a little unusual. I guess they’ve stopped reporting on weekends because I’ve got 0’s for the last two. As a result, I don’t have enough confidence to say that the current wave has peaked. Again, like the US, it will be interesting to see what happens as we move into fall and winter when you’d expect to see an increase in cases.
In the Eastern Mediterranean region, I’ve got data from 22 places with cases up in 15 and down in 7. Of the 15, there were 6 where cases more than doubled. Morocco is the example to show with a large number of cases and a big increase in August.

Another place where the wave is over. They did set an all time for cases during this wave though. A few other places in North Africa also saw big increases but that was in July so Morocco lagged behind them a bit.
I’ve got data from 55 places in Europe. Cases were up in 41 of them and down in 14. And cases more than doubled in a large number of these places. It seems to conflict with the opening table showing a small increase but that is for total cases. Also, a lot of places in Europe were coming off real lows in July. And cases did decrease in the UK, Russia and Spain and that offsets some of the increases observed in places with fewer cases.
I’ll use Germany as the example.

Last year, late summer was quite here so we have another place with a wave that seems out of season. Not yet enough data to say it is over although it looks like it might be. Compared to the UK and other places, this would be a very quick wave.
There are nine places in the SE Asia region where I have data and cases rose in five and fell in four. India continued to see cases drop although only by 8%. In Indonesia, cases dropped by 45%. Thailand has made previous lists and cases continued to rise there and the increase was 80% which is large but not as large as previous months and they did see cases fall the last two weeks in August so it looks like that big wave is done.
The last region is the Western Pacific where I have data from 15 places. Cases were up in 10 and down in 5. There were seven places where cases more than doubled which included Viet Nam which made previous lists and where it seems the wave continues. As an example, I’ll use Australia which is seeing a wave despite some pretty aggressive counter measures.

Australia saw their first wave just after things started and a second, slightly larger one in their winter. Once they got to September, cases have been very low there until early July when things started to climb again. They don’t seem to have peaked yet even though it is late winter there. The number of daily cases continues to set new highs and they’ve basically doubled the number of cases they saw last year.
Again, the pattern just continues to be waves striking various places. Some of it is seasonal and/or geographic. The Delta variant seems to have created waves at different times in some places. Not sure what happens in places where cases are falling now as they head into fall/winter when you’d expect respiratory problems to go up.
