

I won’t have updated numbers from the CDC until mid week but I can say with certainty that my earlier prediction was wrong. Whether this is Delta fueled or something else, the summer wave of this year looks to be larger than the summer wave of last year.
As the calendar moves into another month, we can look at the situation around the world. Which continues to be waves hitting places at different times and hot spots coming and going.
As a reminder, all numbers here come from the WHO and I use their definitions of regions. We can first look at the overall percentage increase across the world and in the various regions for both cases and deaths.
| Cases | Deaths | |
| Africa | 21.9 | 22.1 |
| Americas | 6.8 | 5.7 |
| Eastern Med | 14.3 | 8.7 |
| Europe | 7.3 | 2.9 |
| SE Asia | 9.8 | 16.2 |
| Western Pacific | 26.7 | 18.7 |
| World | 8.7 | 6.9 |
Overall, cases increased by 8.7% and deaths by 6.9%. The biggest increase in cases and deaths were in the regions of Africa and the Western Pacific. These also happen to be the two regions with the smallest number of total cases and deaths. Europe and the Americas were below the world average with a very small increase in deaths in Europe. But, as we will see, each region has places where cases were growing and places where cases were shrinking.
With specific countries, I only track those with more than 5000 total cases. So the numbers in the next sections only count those countries and not everyone in a particular region. And the WHO counties territories as well so when I say countries, this is what I mean.
Also, what I’m looking at next is a comparison of total cases in July to total cases in June. That is different from the first table which looks at total cases across time. But it gives a better idea of the current hot spots in the world.
If Africa, there are 43 countries with more than 5000 total cases. Cases were up in 24 countries and down in 19. Hard to detect any geographic patterns but many of the biggest increases were in the southern part or along the western coast near the equator.
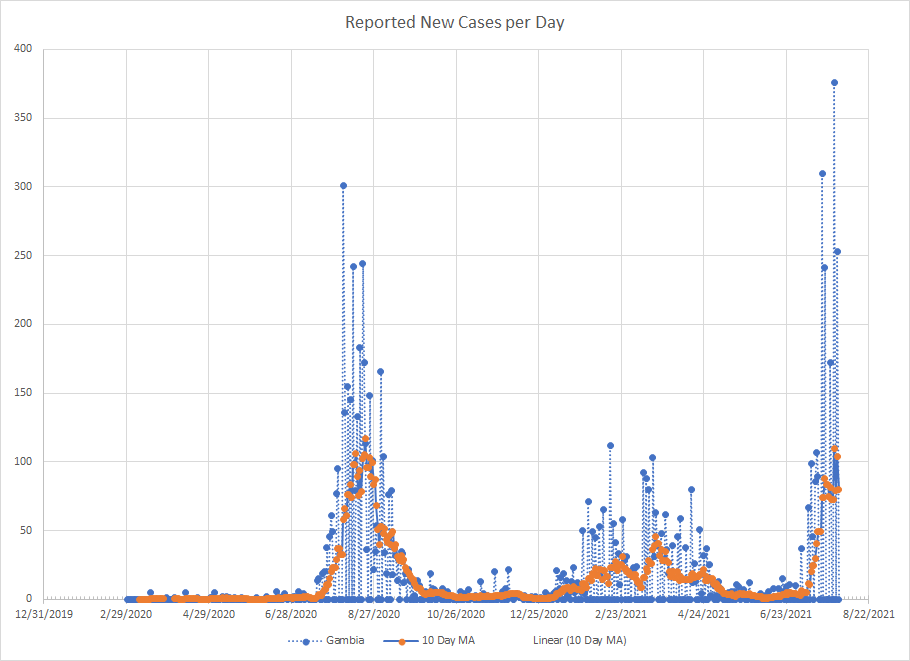
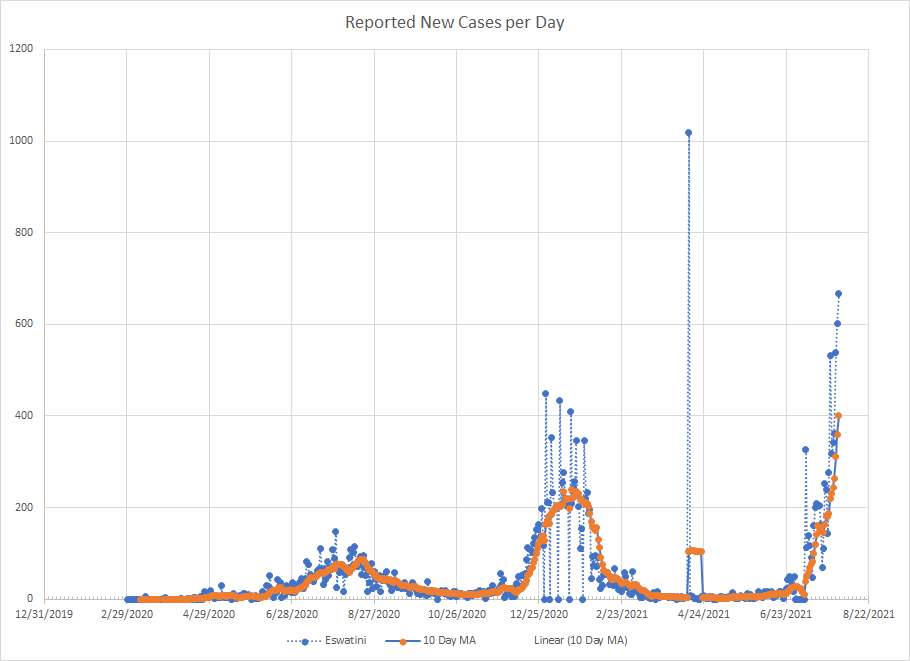
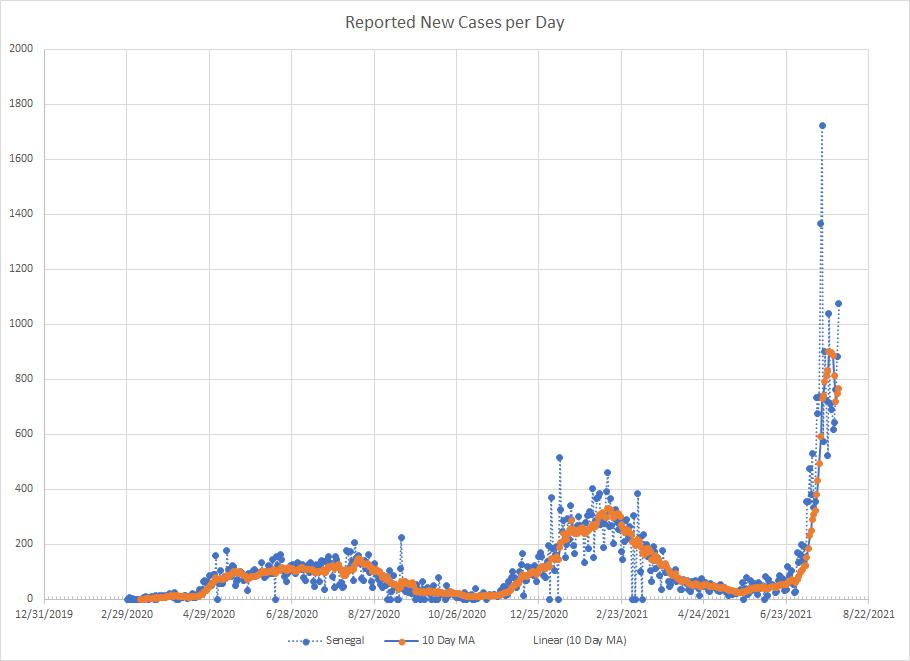
There were three countries that saw more than a 1000 percent increase during July. Gambia which had 86 total cases in June and 1883 in July. Eswatini which had 493 cases in June and 6431 in July. And Senegal which had 1570 cases in June and 18288 in July. Other places with large increases included Malawi, Mozambique and Zimbabwe. The biggest drop was in the Central African Republic which had 56 cases in June and 10 in July.
Here are graphs for the top three starting with Gambia. The pattern this year is similar to last year but shifted in time. Last year, cases where essentially zero until mid July when they started to rise hitting a peak in mid August. This year has seen higher individual days but the average has not yet passed the peak from last year. This year, the wave started about 10 days earlier, so if the pattern from last year holds, it only has about two weeks left to run.
Next we come to Eswatini which is in the southern part of Africa between South Africa and Mozambique. Outside of one odd day in April, cases had been very low there until about July 7th when the current wave started. They are now at an all time high for average number of cases and there is no clear sign of this wave slowing.
Lastly is Senegal which surrounds Gambia on the Western Atlantic Coast of Africa. Senegal also hit an all time high for cases in this wave which started around June 30th. It looks to have peaked on July 26th as cases have dropped off since then.
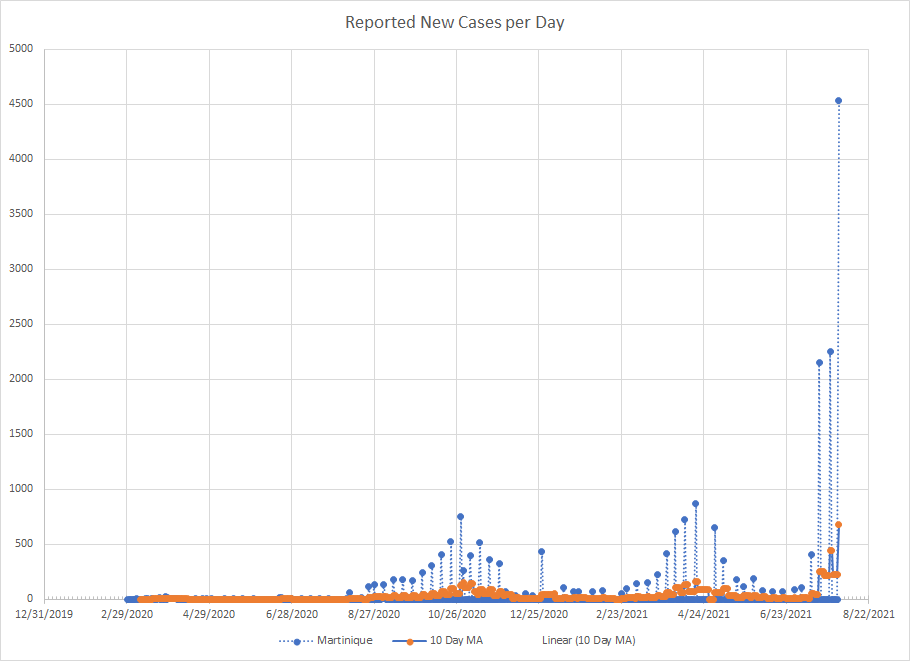
In the Americas, I’ve got 35 places with more than 5000 total cases. Cases were up in 17 and down in 18. Again, no real geographic patterns emerge. Cases were down in both Canada and Chile which sit at opposite ends of the region. The biggest increases were in two places in the Caribbean. Martinique which had 307 cases in June and 9467 in July and Curacao which had 61 cases in June and 1161 in July. The two islands aren’t close to each other so it isn’t like a particular region is being impacted. Cuba was a hot spot last month and cases were still up 300% there. Many of the bigger countries in South America saw cases drop lead by Chile where cases dropped from 176267 in June to 60491 in July.
The graph for Martinique is shown below. This is one of those places where reporting is sporadic so there are many days with 0 reported cases. There were three big spikes on the 17th, 25th and 31st of July and those represent the three largest number of daily reported cases since things started.
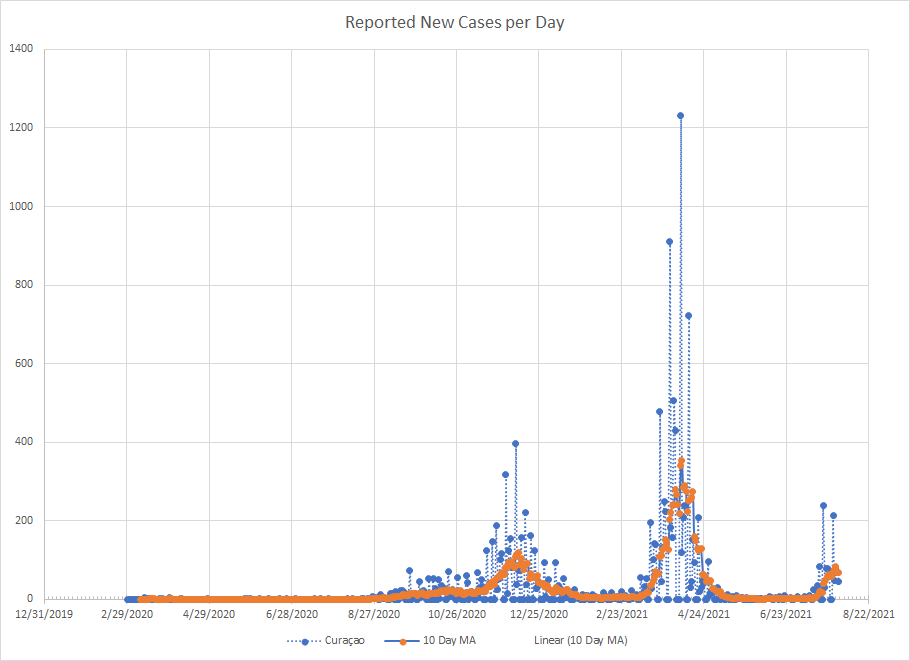
In Curacao, the picture doesn’t look as severe. There were two big days on the 20th and 27th but they are far below the daily highs from earlier this year. The growth rate doesn’t look to be as steep as some of the other places above where cases had increased by more than 1000 percent.
What is called the Eastern Mediterranean, has 22 places. Cases were up in 10 and down in 12 so we get another 50/50 split. The two places with the biggest increases were Morocco (up 636%) and Libya (up 585%). Tunisia also showed a big increase although not as bad as June so three of the four biggest increases were in North Africa. Of course, Egypt, which is also there has cases fall 84% in July so it was not a universal increase. Bahrain saw cases drop by 88% which was the largest decline. I’ll skip the graphs since I’m looking at the biggest increases.
Europe is the biggest region with 53 places. Although based on the total number of cases, Europe saw the smallest increase, 40 of the 53 places saw cases go up in July against only 13 that saw decreases. Five places had increases of more than 1000%: Malta, San Marino, Jersey, Iceland and Israel. San Marino is landlocked within Italy while Malta, Jersey and Iceland are islands but not close together so no real geographic patterns. The biggest decrease was in Latvia where cases dropped by 65%.
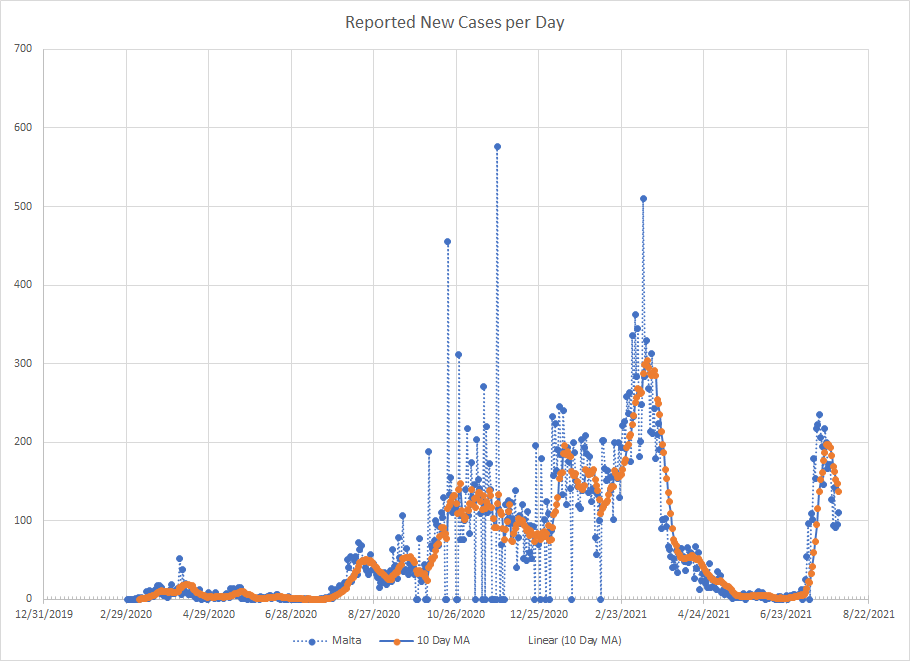
The first graph is Malta which has 90 cases in June and 3567 in July. The graph is not really problematic. They had a two week period of rapidly rising cases but cases have already started to drop and the peak did not reach previous highs. I would love to understand what triggers short term things like this because the increase looks scary but then it just ends.
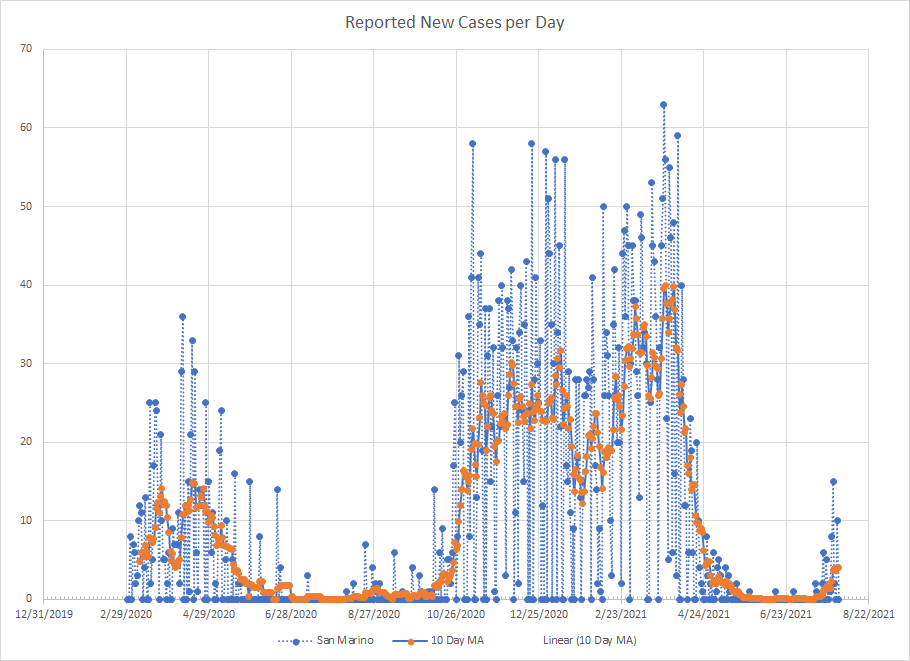
The next graph is San Mario which went from 2 cases in June to 52 cases in July. I included it because the increase is large but they also have not come close to previous highs.
Jersey is an island off the coast of France that is a self-governing British Crown Dependency. The went from 213 cases in June to 4725 in July. They did set a new peak high and recorded the highest new daily total since things started in July. But cases have been dropping of late. In this case, the spike was about three weeks but another place where it kind of fell apart after a short period of time.

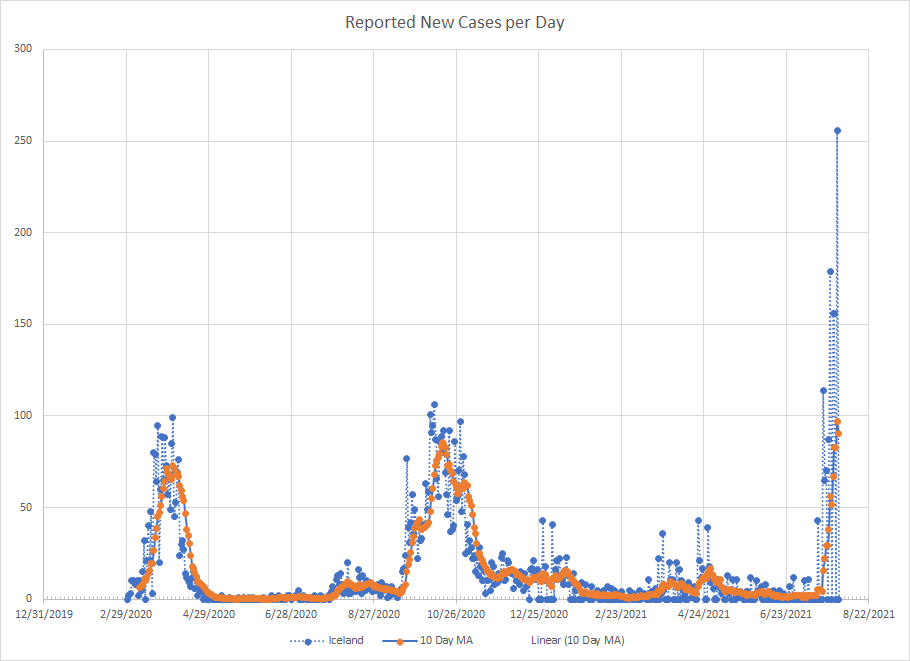
Iceland is next where cases went from 73 in June to 1147 in July. A lot of these places have similar stories with sharp waves mixed between periods with essentially no cases. For Iceland, the current wave looks to have started on the 19th and does not appear to have slowed yet. They have hit a new high in average cases and also saw the highest daily total since the start in this last month. The previous waves were relatively short (3-4 weeks) so we’ll have to see about this one.
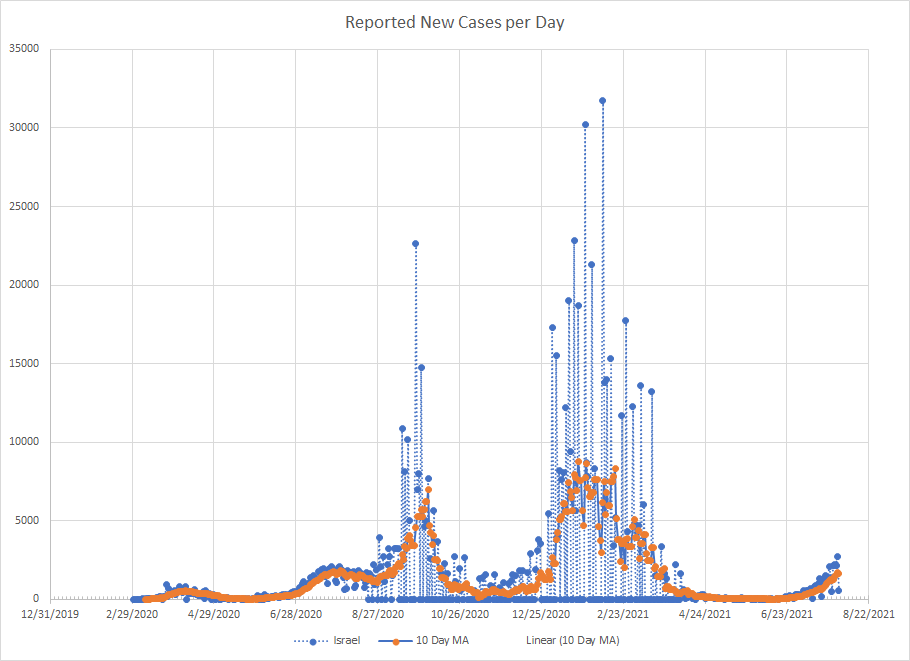
Lastly, we have Israel which had 2024 cases in June and 29732 in July. The graph is a bit odd compared to the rest. Yes, cases have clearly gone up but the increase has been somewhat slow and gradual and nothing like the exponential looking waves we’ve had in other places. And they are nowhere near previous highs for cases. Actually looks a lot like June/July of 2020 where cases were way down in June and we saw a slow rise until late July.
The SE Asia region has nine countries and cases where up in four and down in five. Leading the way was Myanmar with a 1046% increase from 12380 cases in June to 141908 in July. India had been a problem in June but cases were down 46% in July. The Maldives actually saw the biggest drop with cases down 60% from June to July.
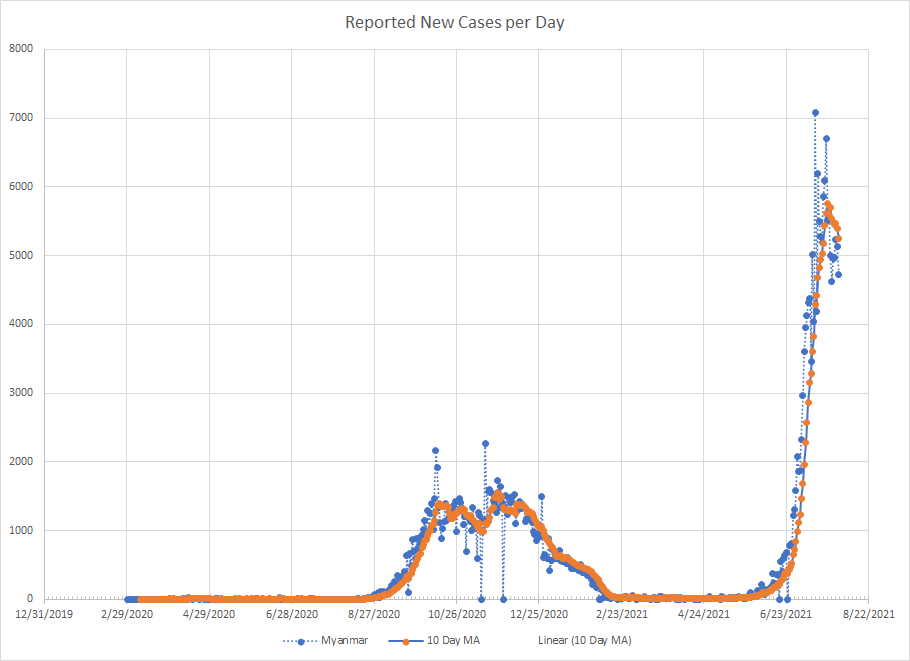
The graph for Myanmar is shown below. The increases started in early June but the curve didn’t start to ramp up until about June 26th hitting a peak on July 23rd. The peak was way above previous highs but cases have been dropping since then. They remain at high levels compared to the past but the trend is no longer increasing.
The last region is the Western Pacific with 15 places. Cases were up in 11 and down in 4. The two biggest increases were in Laos and Viet Nam. Other big increases were in French Polynesia and Australia. Although in Australia the actual number of cases increased from 464 in June to 3352 in July so the actual increase wasn’t that large.
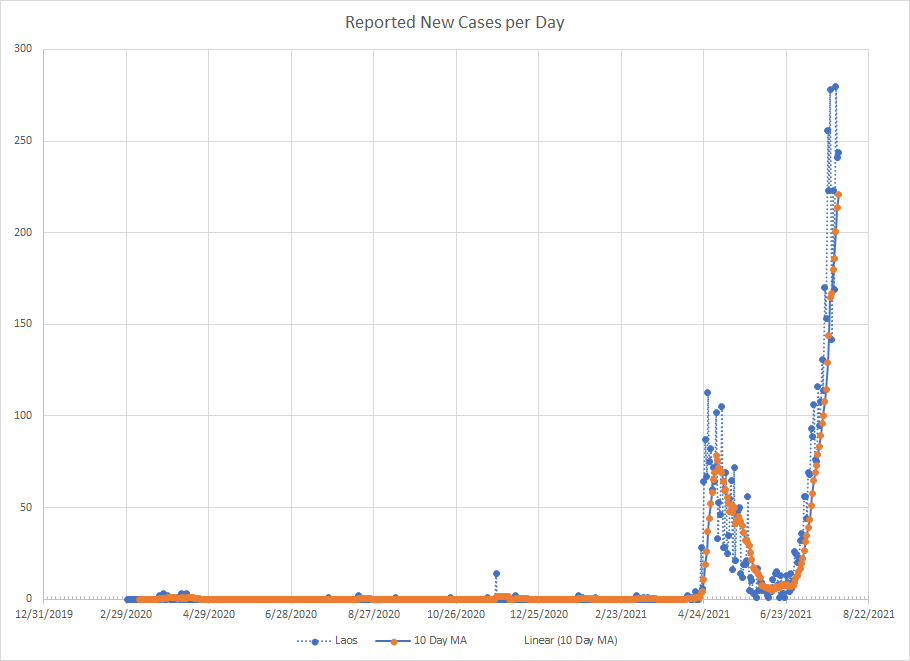
Laos is interesting. There was almost no activity until late April when there was a first wave. At this point, they were under my 5000 total case requirement so I wouldn’t have included them as a hot spot. In fact, they just crossed over 5000 cases which is why they are included now. The second wave started in late June and the average has not yet peaked. Would love to understand how a place can be basically untouched for a year and then have cases just take off.
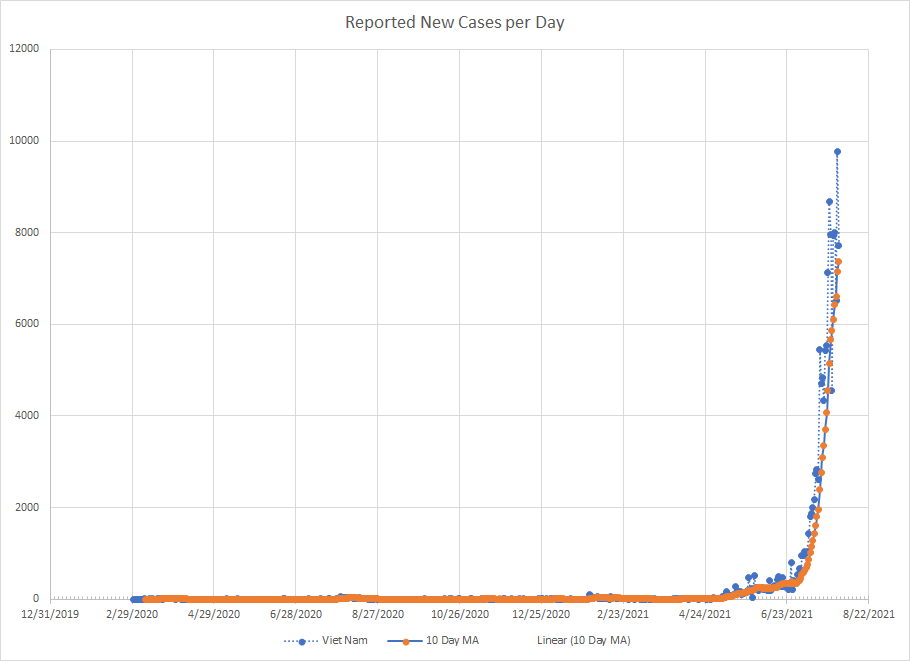
The last graph is from Viet Nam which has made these lists before. Another place that was essentially untouched until April when they had what looks now like a very small increase. Cases really began climbing in late June/early July and are clearly at new highs without yet showing any real signs of flattening. Given that these waves typically don’t go longer than 8 weeks, I would expect to see things reverse soon.
That’s where we stand. A random collection of hot spots from around the world. Looks like that will continue to be the case. Each month brings a different set.
