

Another week and the curve continues to be flat. There are places in the world that are seeing increases and I’ll probably try to cover that later. But in the US, things have dropped to very low levels. Everyone should be out enjoying the summer.
We’ll just start with my bar chart of newly reported cases per day going back to mid March. One thing I’ve said before that needs to be repeated – do not expect this to drop to 0. As long as we keep looking for something, we will keep finding it. What is important is that we’ve now gone over two weeks with less than 20000 newly reported cases per day.

To add some numbers for context, for the week that ended on the 12th, there were a total of 111,499 newly reported cases. This is the lowest number of newly reported cases since back in the last week of March 2020 when things were just getting started and we didn’t have the testing capacity we have now.
There were 7.6 million new tests reported which is up a bit from the previous weeks but we seem to have settled in on 7.5 million tests per week and, given the prevalence, that is way too high. The testing industry has no interest in seeing this number drop. With cases at an all time low and testing still high, only 1.5% of the results recorded last week were positive. This is also an all time low and continues the pattern of weekly drops in this figure – now we are at eight weeks in a row.
Another thing that needs to be repeated is that no test is perfect and, at the current level, it would not be a shock if almost half of the reported positives were really false positive. Actually, it could even be a lot higher.
In the last week, there were 2752 newly reported deaths. Now, this is not the number that died in the last week because reporting of deaths lags – sometimes quite a bit. Still, this is the lowest number since March of 2020 when things were just getting started and we’ve now had two weeks in a row of levels like this. Again, this is not going to drop to zero either unless hospitals simply stop testing everyone. But the levels are so low that it is not something to be overly concerned about.
I didn’t show them all last week so I’ll just run through the region by region graphs. In the Northeast, the virus hung around through much of April before things started to drop. Over the last two weeks, all of the states have hit some kind of bottom and the levels are similar to what they were in June of 2020. We should expect things to stay flat over the summer.
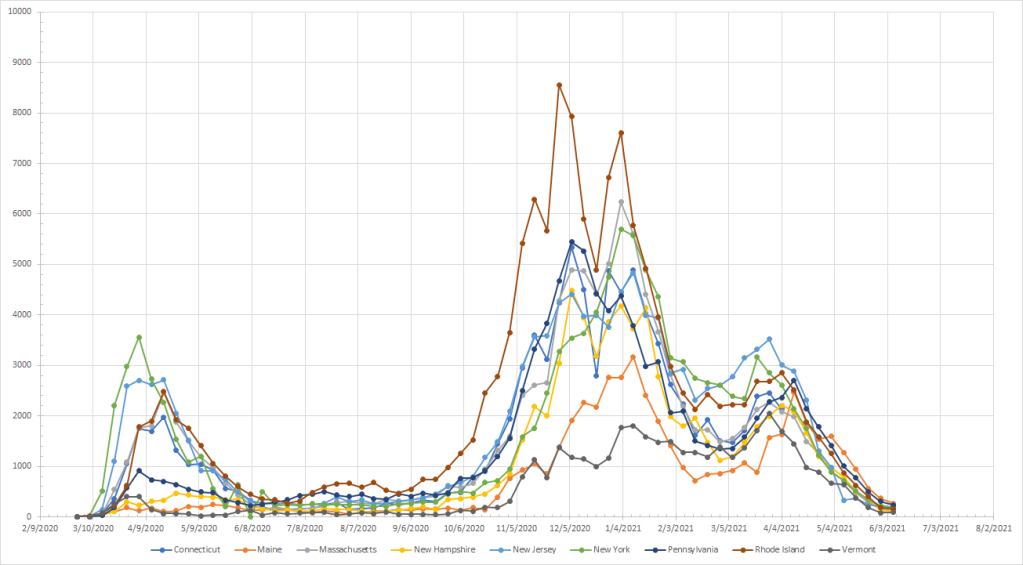
Moving down the Atlantic, we get the next group of states. When this really hit last year, we missed most of the winter and the seasonality was working against a major spread like we had in the fall. So some states here had waves in the spring while others weren’t touched until the fall. You see that the virus held on in April but has now dropped everywhere – to levels that are below last year at this time. North Carolina had been seeing a small rise that peaked in early July of last year but that is not the case this year.

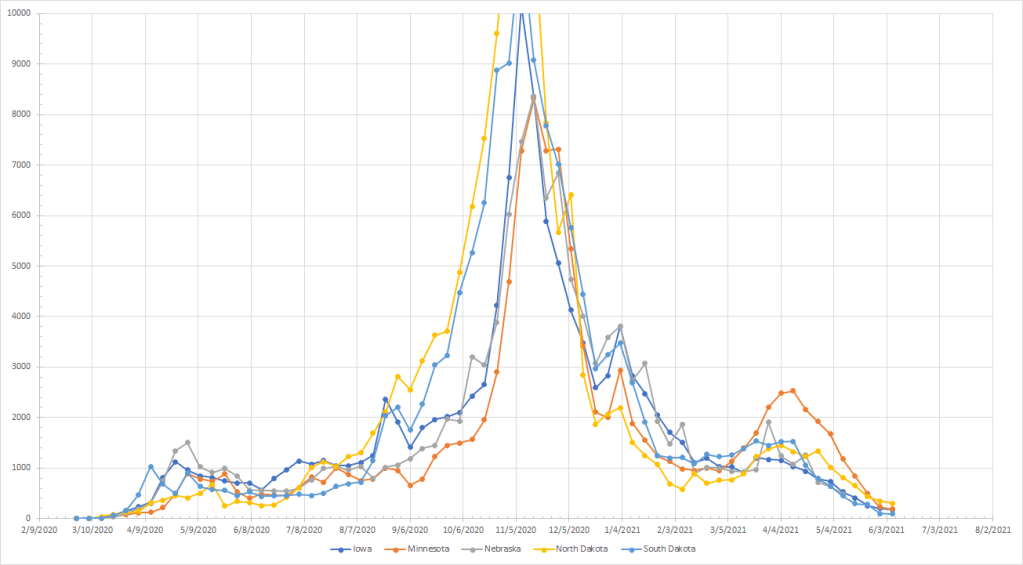
In the Midwest, Illinois and Michigan were impacted in the spring and then every state was impacted in the fall. Michigan had the sharp rise in March/April and Illinois saw a small rise while it was mostly flat in the rest of the region. But, starting in May, cases dropped again and have hit new lows everywhere with levels lower than this time last year.

The states in this region weren’t impacted when the virus first arrived. Like North Carolina, parts of Tennessee participated in the Sun Belt wave so cases increased there in June. The other two saw small increases in July before all three were hit in the fall. The virus held on longer in West Virginia than in the other two states but all three are now at levels similar to or lower than this time last year.

Into the deep south, another region that really didn’t see an impact when things first hit. All of the states saw increases in the summer starting just about this time and then the second wave in the fall. Florida had a mini rise in April of this year while the others just saw cases continue to drop. They are now at levels near or below this time last year. There is no sign of any upturn although the summer wave wasn’t obvious here until later in June.

In the upper Midwest, you saw some increases in some places though April and May and then things were flat until August when the fall wave started. Minnesota was like Michigan with another upturn in April of this year (although not to the same level as Michigan). The rest of the states were flat through April but have seen cases drop in May and June. They are all at levels below where they were at this time last year.
In this next group, Louisiana was impacted by the virus being spread during Mardi Gras of last year. the other states weren’t impacted until June when they all some some rise – the more southern, the bigger the rise. Things stayed at a relatively high rate through October when the fall wave hit. All of them saw sharp declines through February and continued but slower declines since then. They are all at roughly the same levels as this time last year (some lower some higher). Again, there is no sign of an upturn yet but the summer wave wasn’t obvious until later in June.

In the Rockies, you had a mixed picture last year. There was no real wave when things first started and then a few states saw elevations in the summer. All of them saw big increases during the fall wave which started in September here. After early January, cases dropped sharply here in all states except Colorado where the virus hung on through April and early May. All are near levels they were at this time last year. Like other northern states that didn’t see big increases at the start, we won’t get a clear signal until the fall but I’d expect to not see some of the random increases we saw last summer in states like Idaho.

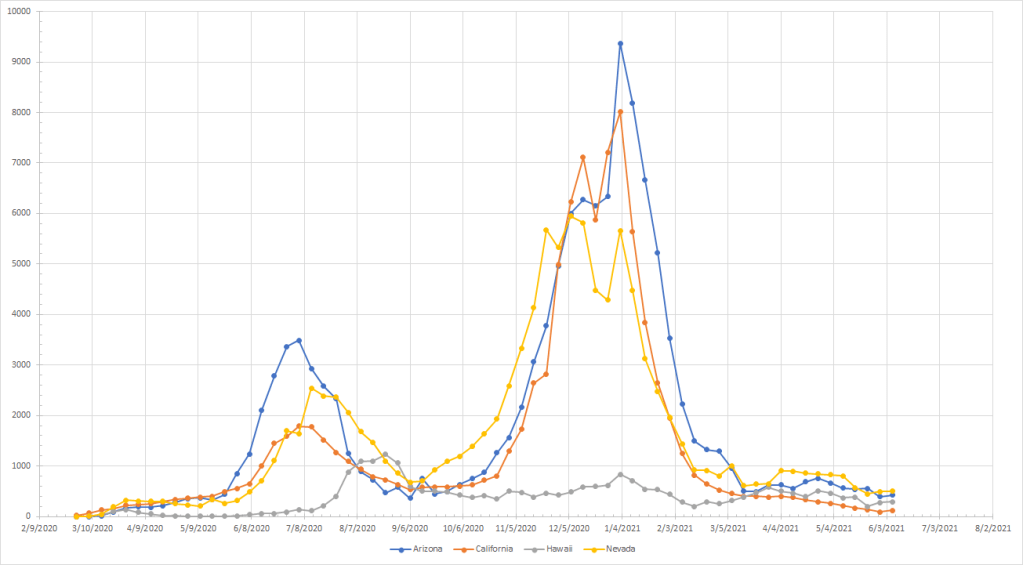
To the Southwest where we also didn’t see much of an increase when things first started. Arizona, California and Nevada all saw increases during the summer and then again in the fall wave. Hawaii has always followed its own pattern. Arizona is the most interesting because, at this time last year, cases were clearly on the way up and there is no evidence of that this year. Cases here have been flat since April.
Lastly, the Northwest where Washington was impacted at the start. The curves for March and April of last year aren’t going to go as high because the testing level back then was significantly lower than it is now so you just weren’t finding the same number of cases. But the region was mostly flat until the fall when Alaska started to see an increase followed by Oregon and Washington. Cases were still elevated until the end of April when things started to decline. They are still on the decline here and are lower than the background rate in July of last year.

Last year at this time, we had just come through the first blow from the virus which hit certain regions very hard. Over a three week period from late May to mid June, we hit a bottom in cases and in percentage of positive results. During the week of June 14th through June 20th, cases started to rise again as the summer wave got going and it didn’t peak until mid July. Arizona was the first to show any signs of this but there is nothing happening there this year. In fact, none of the states that were part of the wave last year look like they are about to turn up.
Another reason for optimism is that there are more things open this year than there were at this time last year. Travel has also increased. So we are getting more mixing of people than we were last year and yet we haven’t seen any evidence of a second summer wave. The news continues to be good and actually even gets a little better each week.
