

As we move further into the summer, Covid seems to retreat more and more. We have now gone 11 days with newly reported cases under 20000. For perspective, there was a day back in January with over 300000 newly reported cases so you see how far we’ve fallen.
I’ll just start with the chart of newly reported cases per day since March 14th. We hit a mini peak the first two weeks in April and things have been dropping ever since.
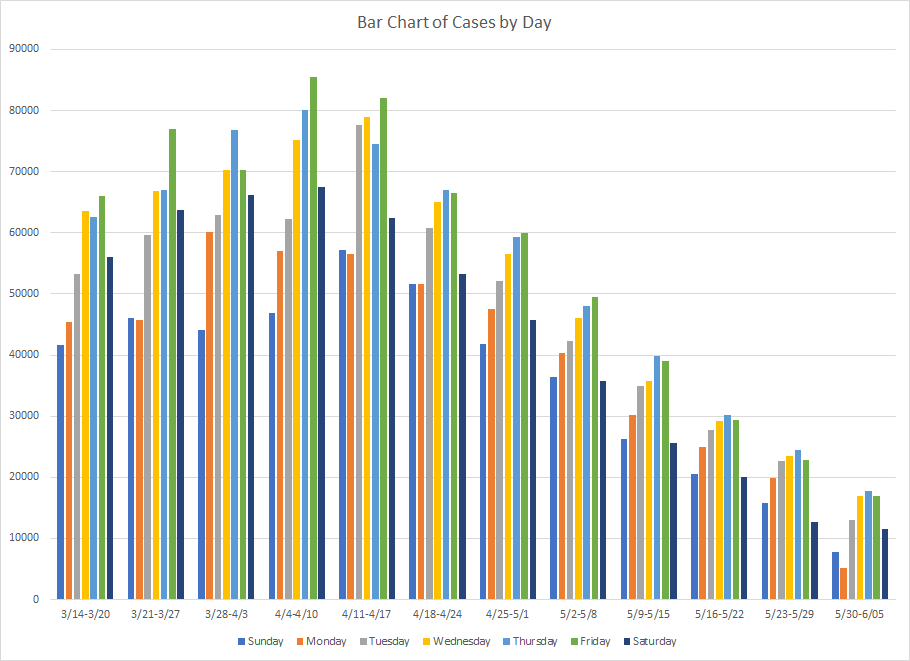
For the last two weeks, the percentage of positive results was 2.4% and 2.3% which means that metric has now declined for seven straight weeks. We’ve been under 3% for three weeks in a row. And every week sets a new low for that metric.
When I look at week over week increase in cases, it is less than 1% in most of the states. Trends everywhere are down or flat. There are no warning bells anywhere in the current data.
Now there are some changes coming. I read that Florida is no longer updating their state’s website. Or at least they’ve shifted to weekly updates for a bit and then will just stop all together. Expect that to happen in other places as well. They’ll still send data to the CDC but all the sites that rely on state websites will no longer be able to capture that data.
When this all started, I was using the CDC but then shifted to the various state websites. I’ve gone back to the CDC and recompiled all the data going back to the beginning of March and I’ll use that going forward.
There are still some places in the world where cases are on the rise but the situation is improving. I’ll probably wait to do an update since the information I compiled at the end of May starts to lose relevance as we move further into June. Have seen small increases in South Africa and Argentina which we watch because they are in their winters right now and this is when we might expect to see another wave. So far, that hasn’t materialized as the places with the biggest increases are concentrated in the tropics.
I’m only going to show one graph this time – focused on the Southwest and Hawaii. The summer wave started in Arizona so it is the first place to look to see if that pattern is going to repeat. Now some of what was going on in Arizona was driven by Mexico which was also spiking last year but is not doing that now.

If you follow the blue line, cases started to rise at the end of May before peaking at the end of June/beginning of July. The rapid increase was after the first week in June but you could see evidence of what was coming. This year, the story is totally different. There is no sign of any increase and we even saw a small drop last week.
While it wasn’t as obvious in California or Nevada, cases had started to tick up there as well at this time last year. Again, that is not happening this year. I could probably toss in the graph from the Southeast which shows a similar story. In fact, let me just do that and add one that includes Texas and Louisiana.
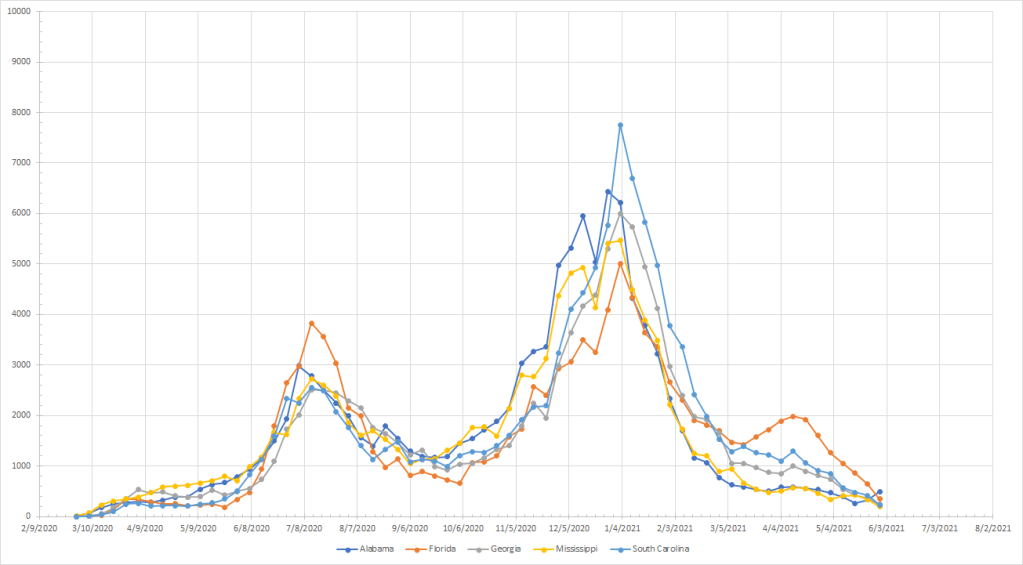
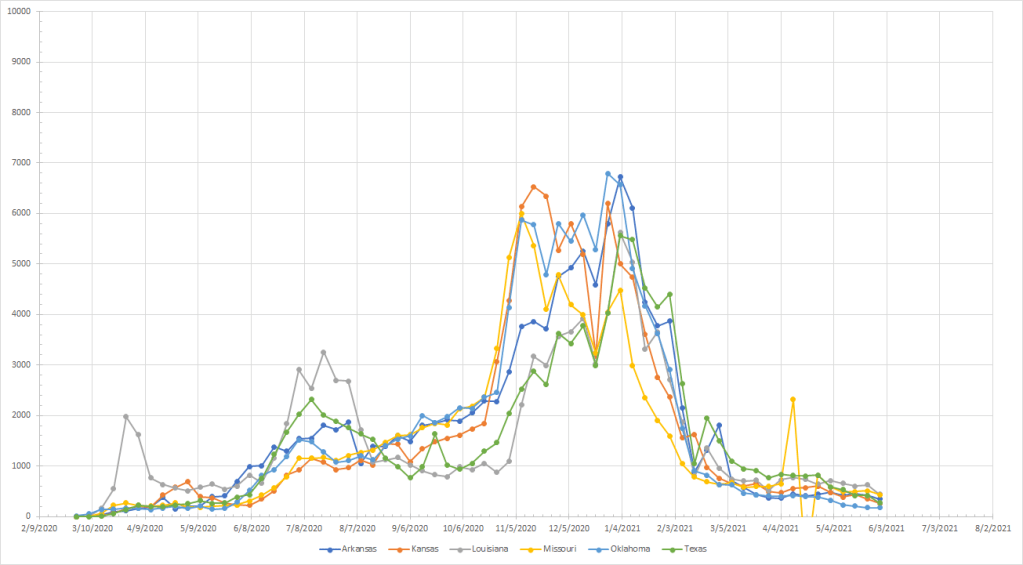
All of these places had a second, bigger wave in the fall/winter but the summer wave followed expected seasonality patterns. The fact that we aren’t seeing a second one is a good sign.
I did want to touch on Florida’s decision to stop updating their website. In my opinion, this is the right thing to do – if we stay at these current levels or drop to even lower levels. We can never get to zero as long as the possibility of false positives exist. At current levels, I’d expect most of the “cases” are really false positives and the daily numbers just become background noise and a distraction. So at some point, you have to just live your life and stop worrying about it.
On a personal note, I’ve been highly focused on this since it started and that’s because I’ve wanted to fully understand the trends and patterns. But I’m going to scale back a bit and maybe update a little less frequency and stop doing some of the daily analysis I was doing. The story right now is boring but boring is good.
