


Well let’s just jump right in and say that whatever little bump we were seeing in April is over. You can credit vaccines or seasonality or some combination of the two, but cases have been in free fall for the last couple of weeks. All the talk about variants seems to be just talk as they didn’t kick off any type of new wave.
So here is my bar chart updated through Saturday. The usual caveats about weekend gaps apply but it doesn’t change the face that the number of newly reported cases was lower every day last week. This now represents the third straight week where this has happened. The gaps got larger as the week went on with about 10000 fewer new cases on each day than the same day last week.

Just to put numbers to it, for the week ending on Saturday, there were 9.3 million new tests reported. That was down very slightly from last week. There were 304,481 newly reported positive results last week which is down 15% from the week before and represents the third straight week where cases dropped by 15%. It seems curious that we would be seeing the same magnitude of decline unless these things follow predictable patterns.
The figure for last week was the lowest since the week ending on October 3rd when we had 298,062 newly reported positive results. Back then, we only had 7.2 million tests so we are testing at much higher levels. The result is that only 3.3% of the reported tests were positive last week. This is down from last week and is now the lowest reported percentage of positive results since this whole thing started.
Newly reported deaths were down slightly last week from 4870 to 4838. Many of the newly reported deaths are from Michigan which was really the only place that saw a significant increase in March/April. As deaths are a lagging indicator, we’d expect that to continue to fall off since the situation in Michigan has improved. While I don’t report them, data on hospitalizations and ER visits taken from the CDC website were also down and continue to point down.
Last year at this time, we were coming off the April wave that primarily hit the NYC metro area and other parts of the Northeast. Cases continued to drop until early June when things started to ramp up again in the Sun Belt. Not really sure how much farther things can drop because the false positives will set a floor but if the pattern follows from last year, we should see either continued declines or basically flat levels through the next month. If we don’t see a significant new Sun Belt wave, then that is a potentially a good sign for the fall and maybe a signal that this pandemic will die out like others before it.
While cases declined in total, there were eleven states that saw increases: Kansas, New Jersey, Arkansas, Wyoming, Maine, New Mexico, Louisiana, New York, West Virginia, California and Alabama. New Jersey is an artifact of some adjustment they did to the data so I’m not worried there at all. I’m also not counting Kansas because the site I use just didn’t report anything for last week. Most of the rest are just bouncing off lows and haven’t established any real patterns yet. In places like Arkansas and Wyoming where we have seen steady increases, the growth rate is not alarming. Maine has been on the bad list for awhile. Cases have fallen off their peak but the decline may have stalled for a bit. Other places that were problematic have seen things start to fall.
I’ll get to the graphs but this may be the first time in a long time where the overall trends are positive in every state. I think you’d have a hard time finding a place to be all that concerned about.
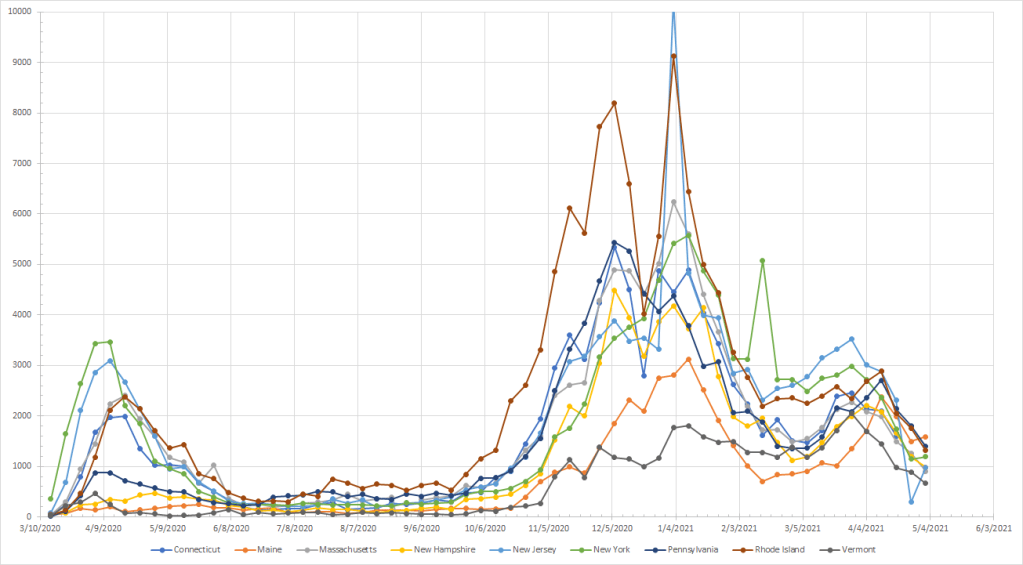
On to the graphs and we start in the Northeast. The green line is New York and you can see a small increase last week but the overall levels are still well below where they were earlier this year. You see the same type of increase in Maine and Maine is still above their lows of February but we do see declines stall out from time to time so it is highly unlikely this is a signal of a new upturn. All other states continue to show declines.
Moving down the coast a bit, we get this next group. Delaware had been the only problematic state but cases have now been down for three weeks and last week represented a new low for the year and the lowest total for them since back in early November. The upward trend is gone and they should soon be with the rest of the states in this group.

Coming back up to the Great Lakes, we get this picture. The drop in Michigan continues although they still have a ways to go to get back to the lows from earlier in the year. After a rise two weeks ago, cases in Indiana did drop last week but they look more flat than the other places where the trend is clearly downward. Still, flat is not rising and there isn’t a place here that looks like a problem.

In this next group, cases are basically flat in West Virginia and Kentucky and falling in Tennessee. West Virginia may be trending down but it is a slow drop and they are still above fall levels. Still having been flat for so many weeks, there don’t appear to be any issues here. Would be curious about testing levels here and whether this is just the false positive floor.

Into the Southeast which includes Florida one of the two states everyone loves to hate. Kind of wish people could just look at the numbers and ignore the politics of the people running the place but that just isn’t going to happen. Florida was seeing a small rise which has peaked and last week was a low for the year. You can see that the small uptick in Alabama is meaningless in the context of the rest of the numbers and things continue to drop in the other states.

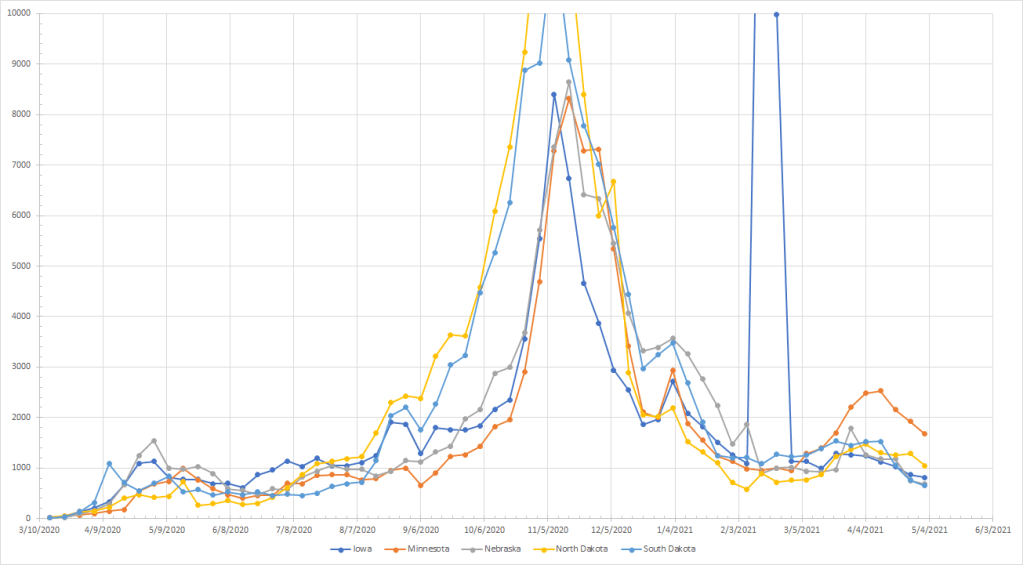
Into the upper Midwest we go. Cases in Minnesota have now dropped for three weeks in a row so whatever was going on in early April is over. They sill have a ways to drop to get back to the other states in the region but the trend looks like it is going there. In case it is confusing, I’ve used the beginning of the week as the point to graph which is why the graph seems to stop on May 2nd. That point really represents the number of cases from May 2nd through May 8th. Have to pick a point to use and I just picked the beginning of the week. But all is well in this region.
We move down and we get the other state that people love to hate – Texas. And we have Kansas which just seems to report when they feel like it which creates some distortions in the graphs. If you stare hard enough, you might be able to pick up the rise in Arkansas but given how flat the line looks, you can see why I’m not worried about it. The world has not yet ended in Texas despite predictions but if you predict doom and gloom often enough, you might be right eventually.

On to the Rockies where we have Colorado which had been moving up slowly for several weeks in a row but saw cases drop rather sharply last week. Should probably not react too much to a single data point without knowing if there was something else behind the drop. Still the size of the drop is encouraging. Wyoming is like Arkansas – if you look closely enough, you might see the increasing pattern but the rise is almost not perceptible so it isn’t a concern.

Moving to the west, we get this first group of states. You may not believe me when I said cases went up a bit in California last week because you really can’t tell from the graph. Again, this is really just random noise because small changes like this can be influenced by testing and other things. Not a sign of any type of trend which is true of all the states in this group.

On to the Pacific Northwest where we had two of our last remaining problem states a week ago. Washington wasn’t seeing a big increase – just a gradual rise which broke last week. Things were also down in Oregon but both states are still above their lows from earlier in the year. But if you look back to November, neither place showed the type of rise they did then so these were like some other states that saw a small bump in the spring and not like Michigan. Again, we don’t want to react to a single data point but history with other places suggest that small bumps like this go away so it would be unusual to see things turn around and start to rise.

So we start May without a single state showing a problematic rise in cases. A few places where the decline has stalled a bit but we don’t have any more states like Michigan. A very good start to May.
