
So we hit the end of March yesterday which is the end of the first quarter and if you believe seasonality is a big factor it is also when we should be seeing things start to decline. That’s not yet the case. There are more states that have bounced off their low and started to see cases on the rise. Some of them are still early in their rise but they are currently behaving similar to Michigan which would be bad news. It will take another two or three weeks to sort out what is going on.
The data in these graphs is taken from the Worldometer site. As I’ve mentioned before, I didn’t really start tracking this site until late April so you won’t see the early part of the pandemic meaning the curves in places like New York, New Jersey, Connecticut, Massachusetts and a few others won’t give you the complete picture. What I’ve plotted are rolling two week sums of cases so each point is the sum of the previous two weeks. As a caveat, I have no testing information here so I have no way of knowing how much, if any of the trends can be explained by testing level. Since testing in the country is down a bit from earlier in the winter, I’m going to assume recent trends do reflect real cases.
I’ve graphed them in order by the percentage change in this figure over the month of March. Basically it compares the last two weeks in March to the last two weeks in February. Any selection of dates is arbitrary because patterns don’t neatly follow the calendar but I’ll try to point that out when it is relevant.
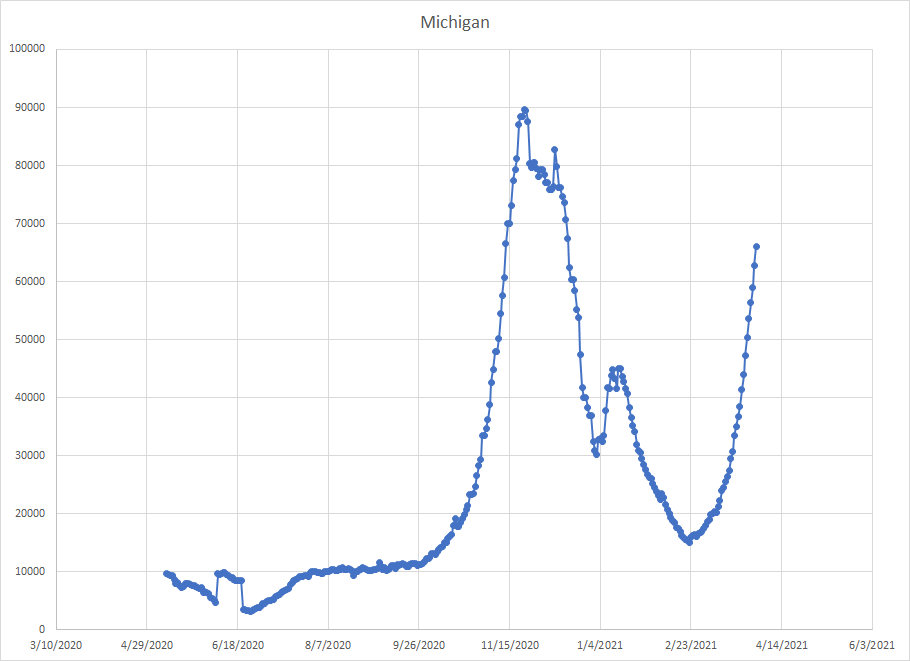
We start with Michigan. The actual low for this sum was back on February 22nd so cases have been rising for over a month. At first, the dots are close together but then you start to see some bigger jumps as time goes on. If I look at week over week change since the 22nd, the figures are 12.5%, 20.1%, 29.7%, 45.2% and 53.3%. In other words, the rate of change has been increased and really sped up after three weeks.
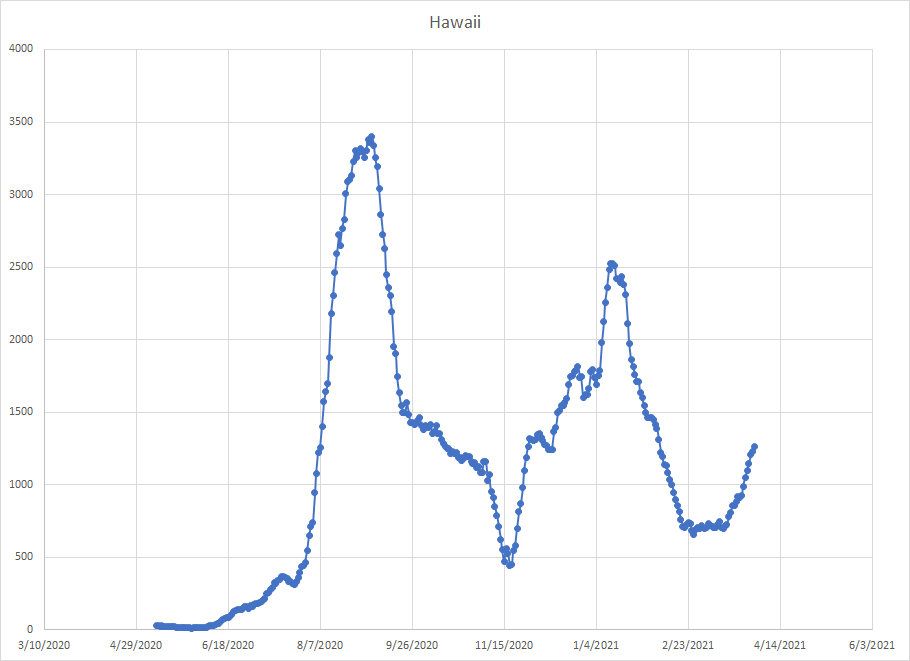
Next on the list is actually Hawaii. Things were flat there from February 20th until March 14th and they’ve been increasing ever since. Hawaii is far removed from the rest of the country and seasonal trends that apply in the upper Midwest and East Coast wouldn’t be expected to apply here. Visually, the slope of the curve is less than what happened in August but we are only two weeks in so more time is needed.
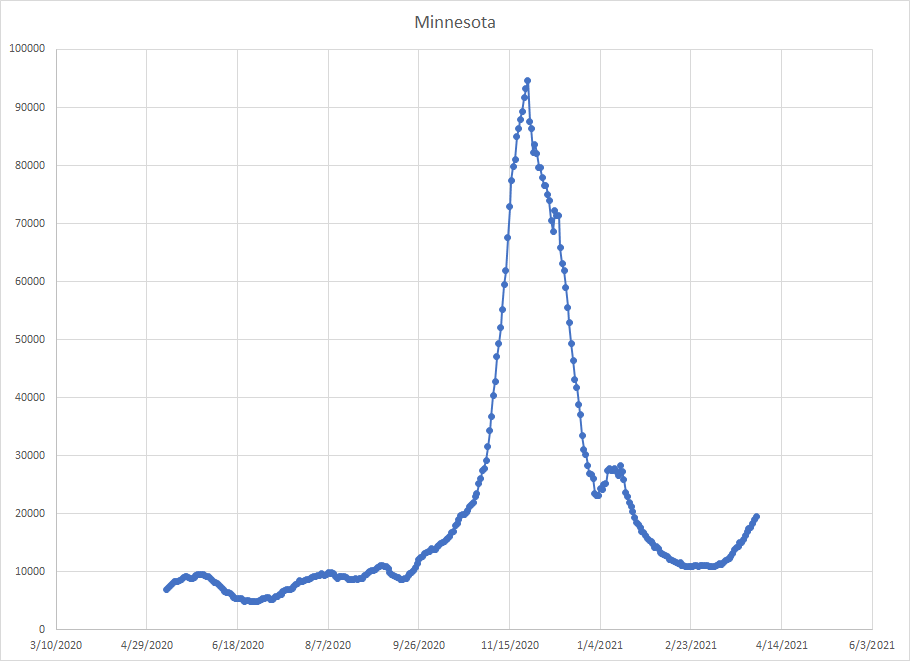
In Minnesota, the first low was on February 23rd which is similar to Michigan. But, unlike Michigan, cases remained flat until March 8th when things started to rise again. For the three weeks we have, the week over week changes have been 10.8%, 24.1% and 22.8%. Did the last week break the trend? For Minnesota, the increase from the low to yesterday is 79%. Twenty three days after the low in Michigan, the increase was 95%. So maybe Minnesota is tracking a little behind Michigan and we won’t see things take off.
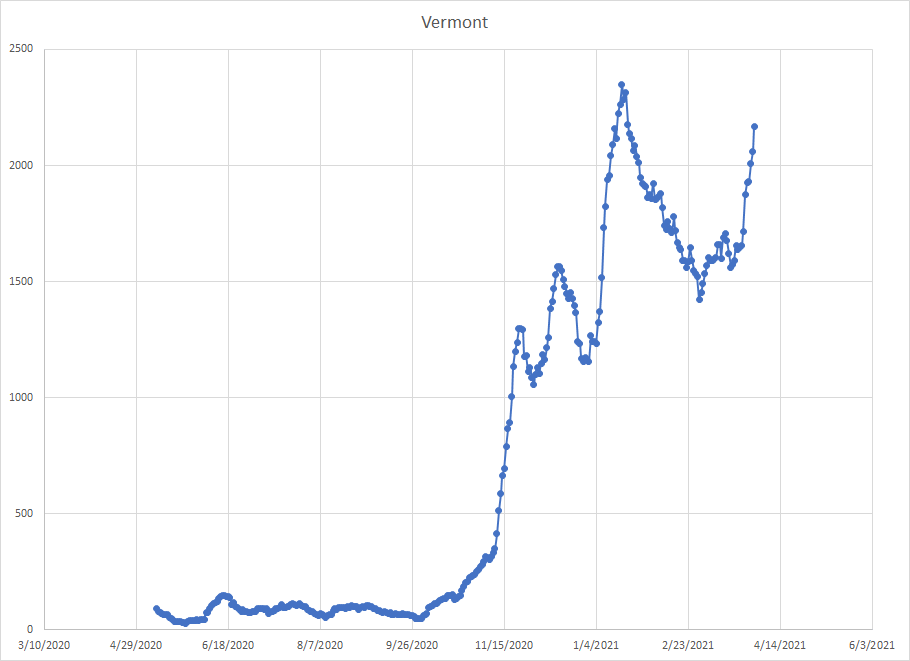
Vermont has always been an oddball in terms of the pattern. But they’ve almost reached the peak they had on January 18th and cases have really only been rising there for about a week. In terms of cases per million people, Vermont is the second lowest behind Hawaii. Could be both states will see a bigger rise just because they’ve not had the same amount of cases as other states.
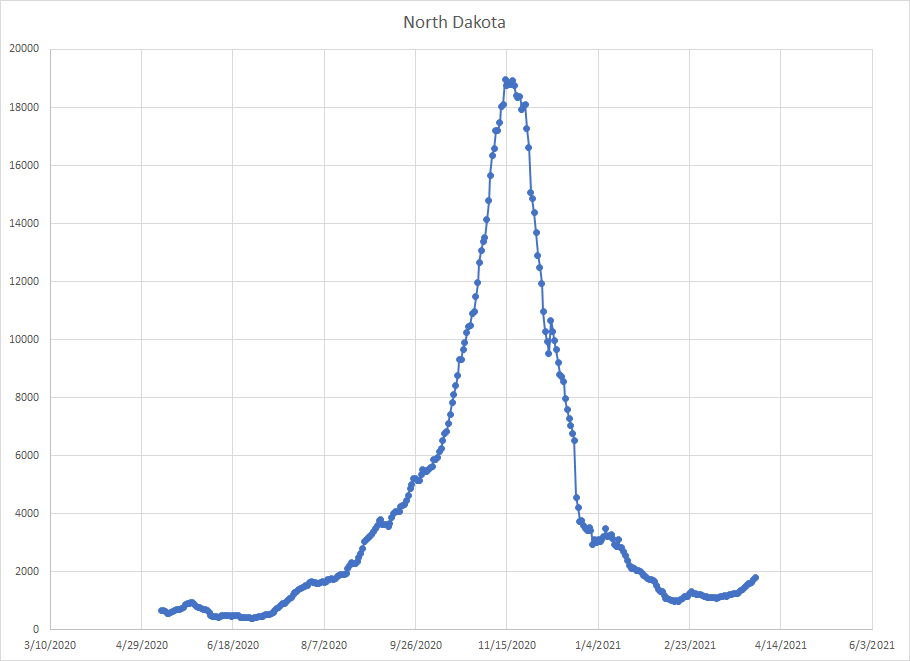
You have to squint to see this since the curve looks so small compared to the rest of the data and is equal to where they were in August. There were some ups and downs in February but the last minimum was on March 10th with cases climbing since then. Over that period, the week over week changes have been 10%, 13.2% and 28.1% so a bit of a jump in the last week. Using my Michigan yardstick, from the minimum, the increase in North Dakota has been 66.7%. For the same time period in Michigan, the increase was 75%. So, even though this looks small, it is kind of tracking where Michigan was before things kind of exploded there. The only thing is North Dakota ranks #1 in terms of cases per million people so I just wonder how far it can really run there.
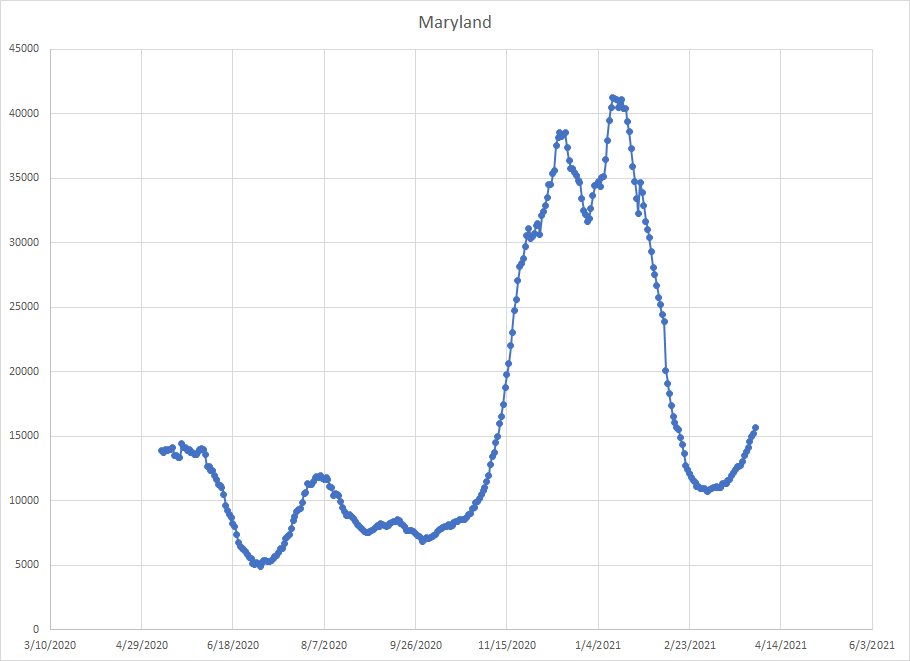
Maryland hit a low on March 5th which means cases have been rising there for over three weeks but the points are still close together. Since March 5th, my two week sum has increased 46.7%. In Michigan, in the first 26 days since the low, the increase was 131.5%. So Maryland is not seeing the same type of rise that Michigan did. This looks more like the summer where there was a small increase before things started dropping again.
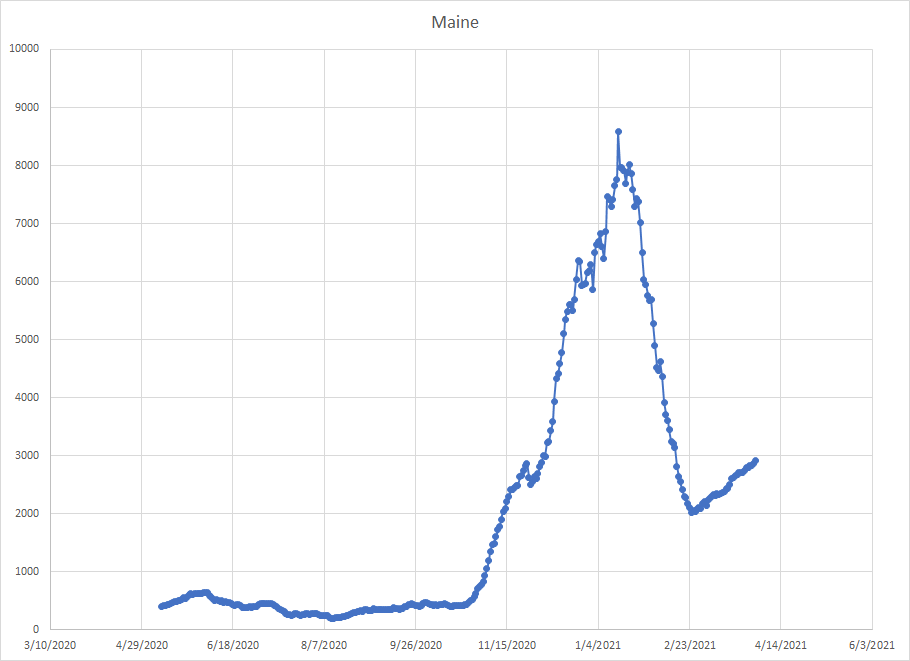
You can already see the increase in Maine looks nothing like Michigan. To be honest, I don’t know of other times where we’ve seen a linear increase. The low for Maine was on February 26th and the sum has gone up 43% since then. For the same period in time from the low, the increase in Michigan was 255% (cases more than doubled). Don’t know what to make of this increase but it isn’t like Michigan.
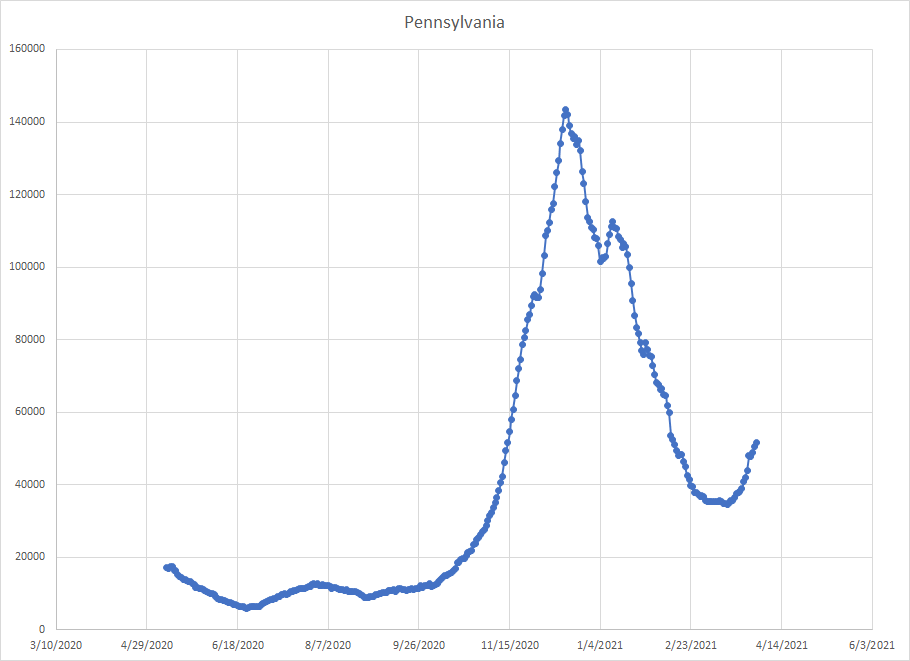
Pennsylvania also had a flat area but has seen things increasing since March 15th. The increase since then has been 49.5% which is above Michigan which was at 40.9% for the same time period since the low. Definitely a place to watch for the next two weeks.
Actually a little worse than Pennsylvania. Hit a low on the same date (3/15) but cases have increased 58.1% since then. Another place to be concerned about.
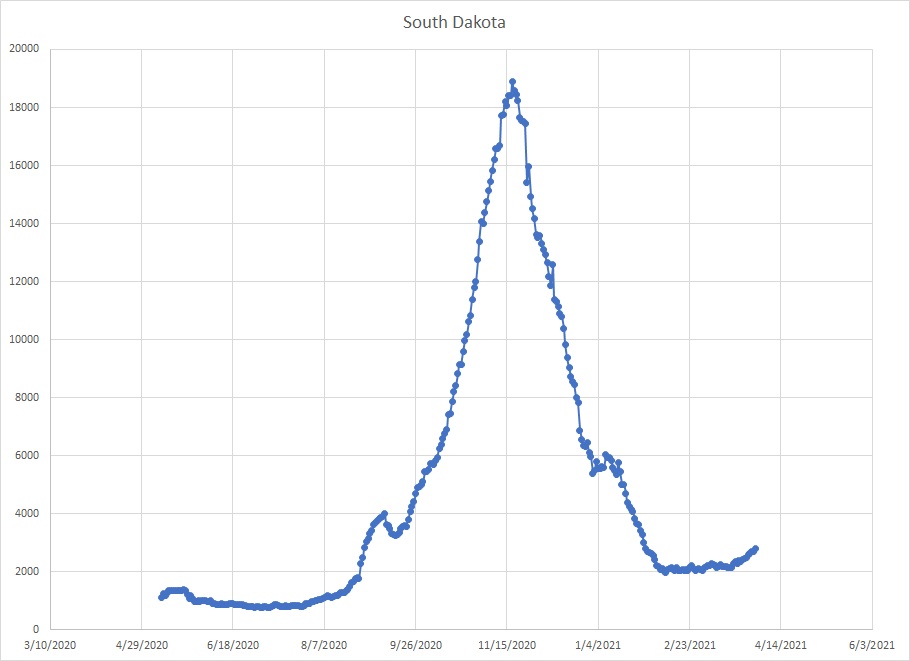
As you might expect, South Dakota is similar to North Dakota. A very long period where cases were flat with things starting to rise on March 17th. In those two weeks, cases here are up 30.9%. Two weeks after its low, cases in Michigan were up 35.1%. South Dakota ranks second in cases per million people so we just have to see how much more this can run as well.
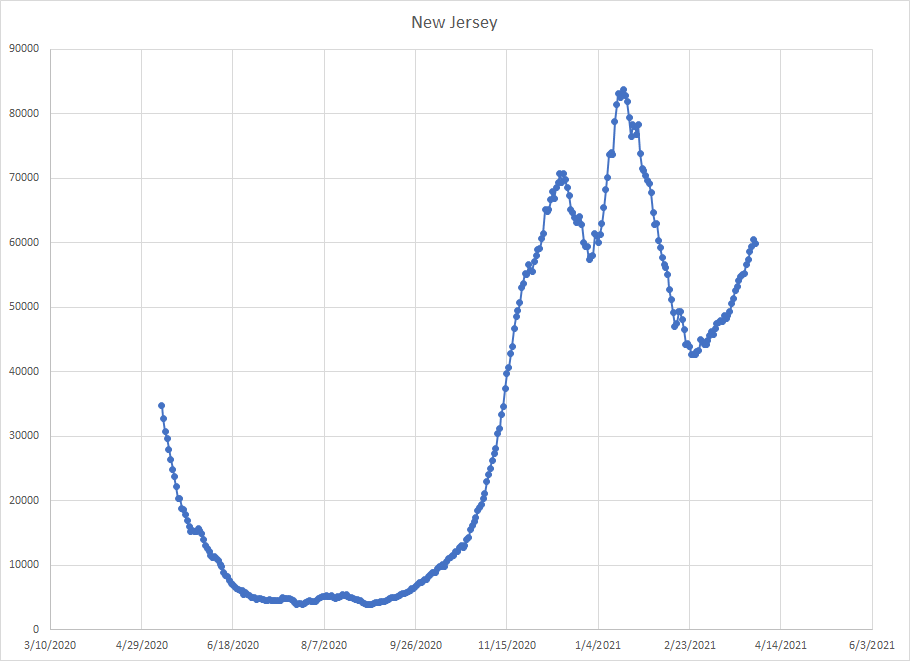
New Jersey hit a low back on February 25th so this increase has been going on for over a month. But it is significantly slower than Michigan with an increase of 40.6% compared to a figure of 273% for Michigan over the same period of time since the low. Seems unlikely to take off.
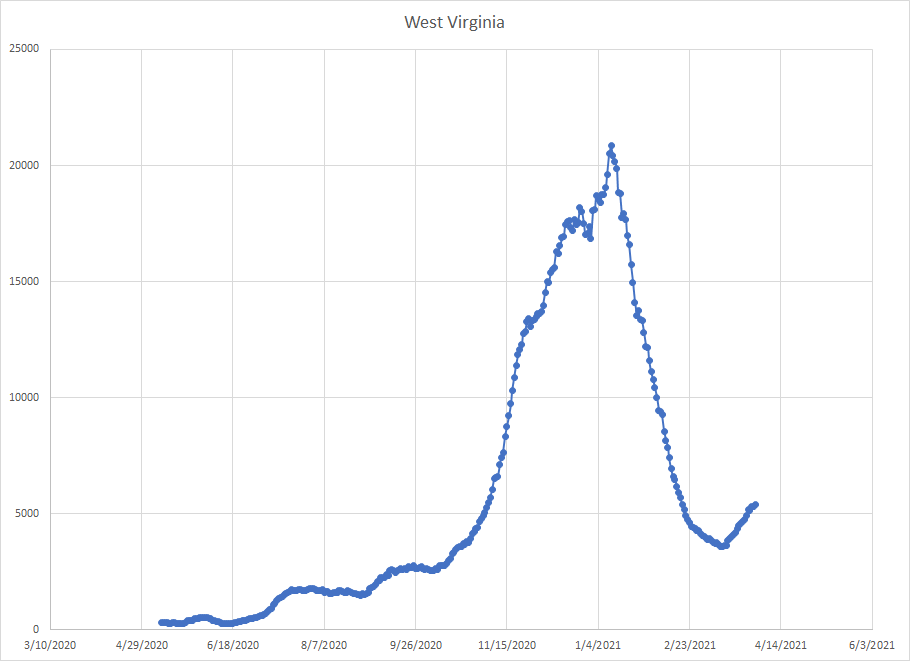
Cases in West Virginia have been going up for about two weeks. Over that time, the increase has been 51.4% vs 58.5% in Michigan over the same time period since the low. Like some other states, it is running a bit behind but the next two weeks will be key to see if it breaks out like Michigan did.
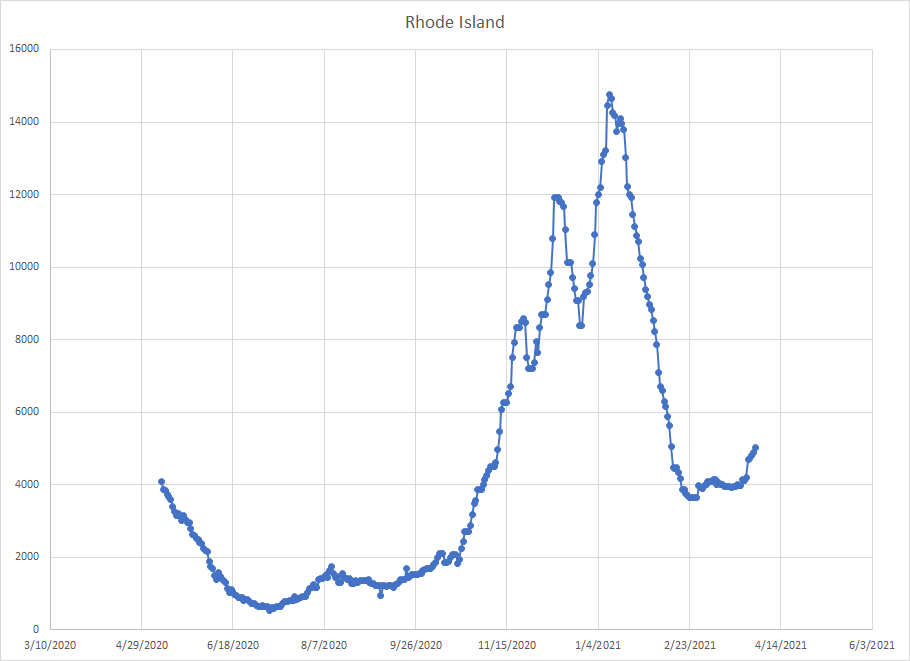
Rhode Island also had a long period where things were flat and then we saw a jump. Because there looks like a one time jump, I don’t think there is enough data to make good comparisons. Just need to see what happens over the next two weeks.
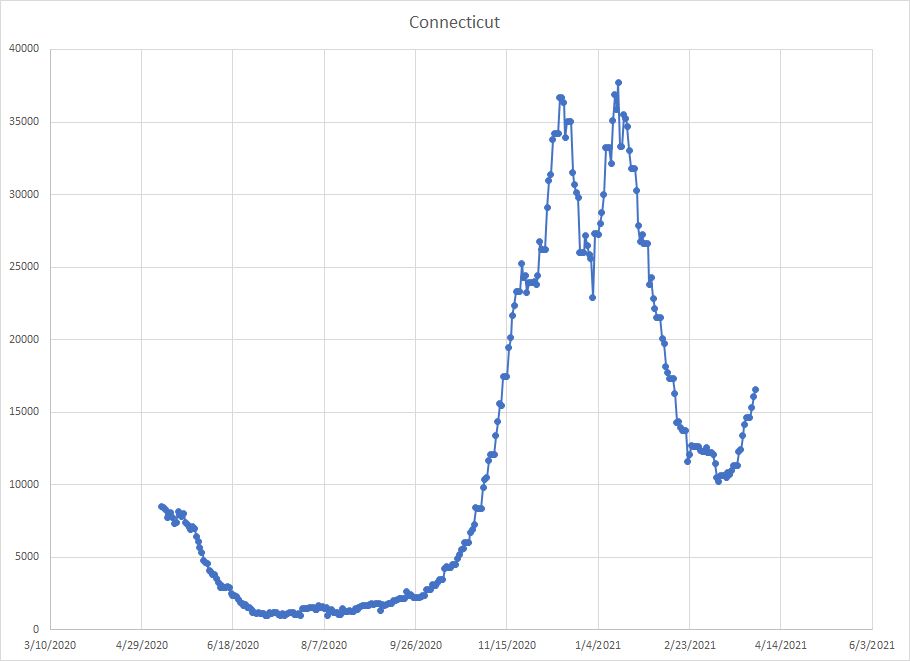
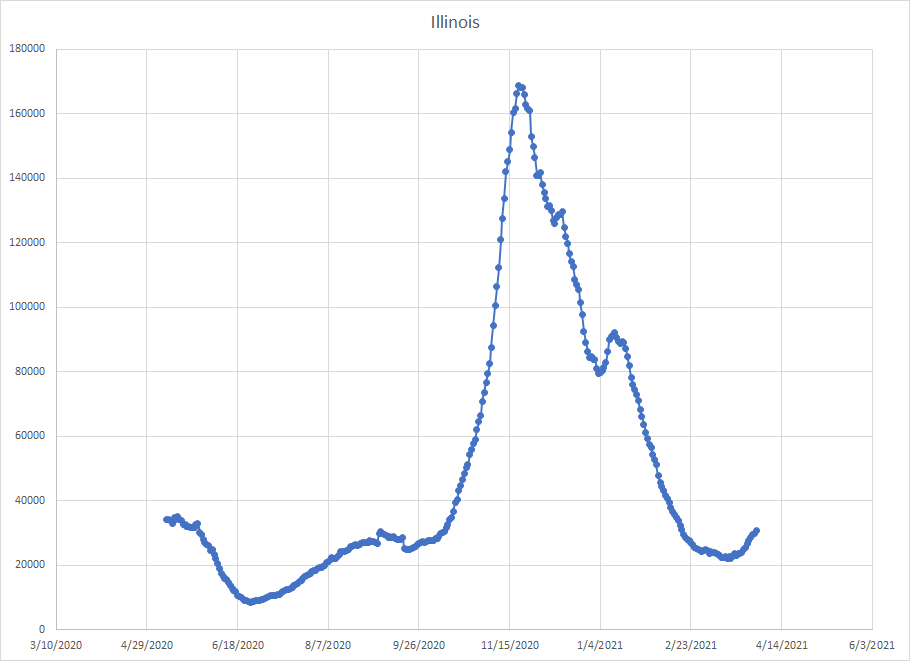
Illinois did some bouncing around a low in early March but the sum has been increasing since March 17th. Like Pennsylvania and Connecticut, it is currently running ahead of where Michigan was two weeks after its low. The increase here is 38.5% vs 35.1% for Michigan. Like the others, we need to watch closely here for the next couple of weeks to see if it breaks out.
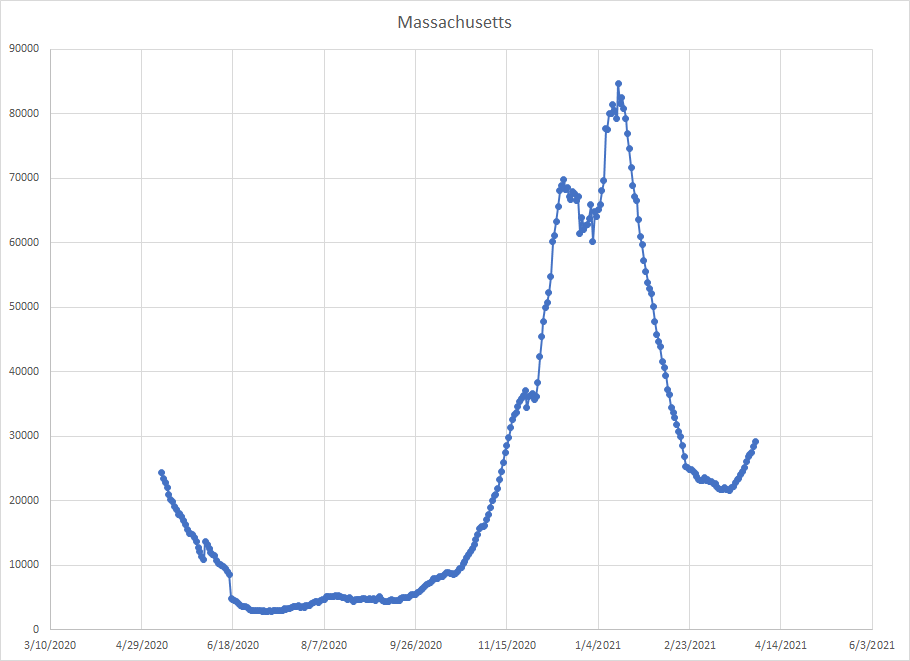
Massachusetts is almost a mirror image of Illinois. The low was hit on March 17th with cases rising since then. The change in Massachusetts has been 35% vs 35.1% for Michigan. Another place running even with Michigan early and we need to see if it breaks out over the next two weeks like Michigan.
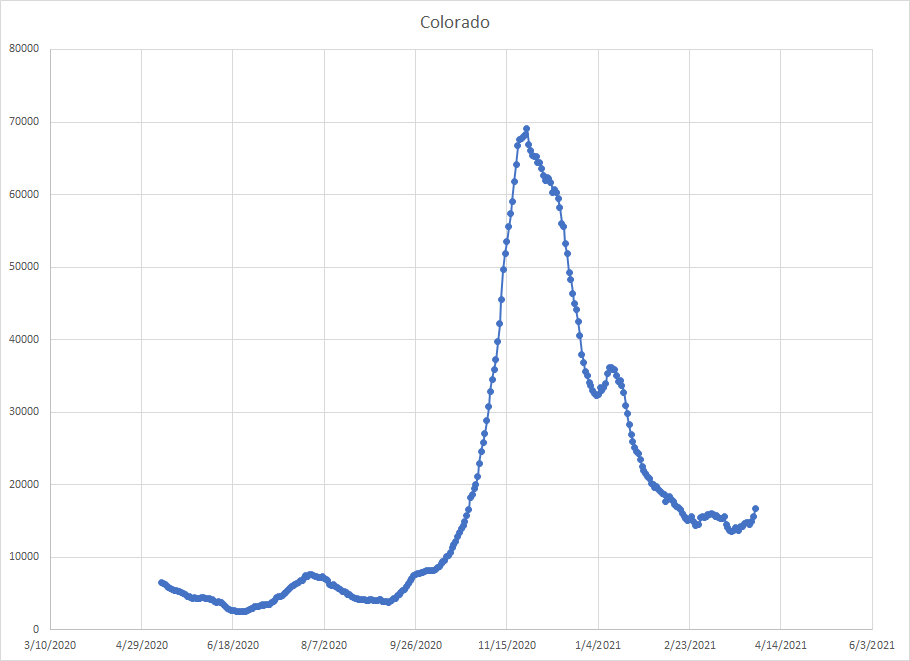
Colorado had a series of ups and downs in February and early March. After March 22nd, cases have been on the rise here. They are also running slightly above Michigan (21.8% vs 19.0%) at similar points in time. I’m not really sure how comparable some of these places are since Michigan rebounded right away while many of these states had a long period where cases were flat or slowly declining before starting back up. I guess we just need more time to know if that is important.
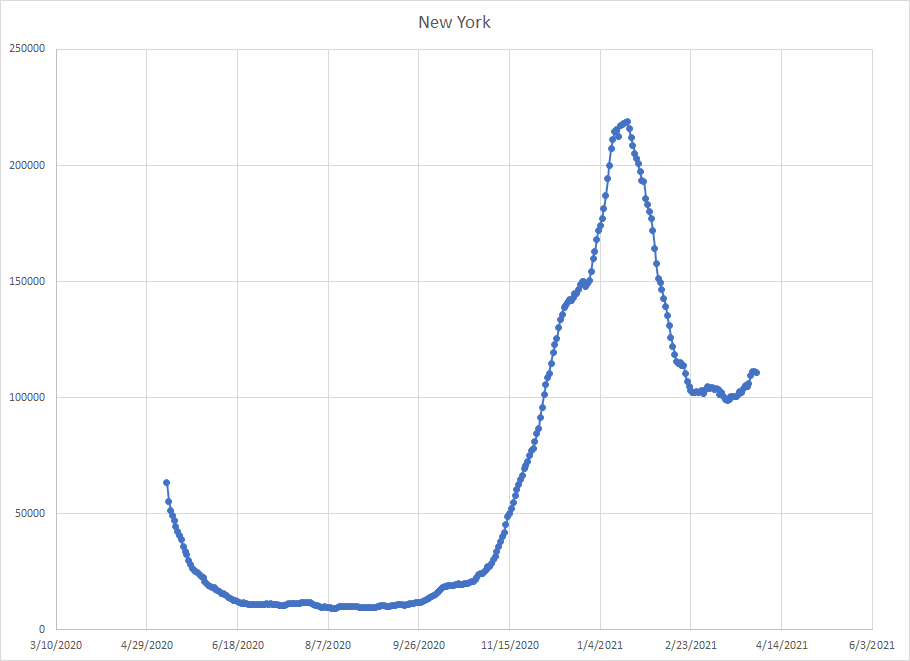
New York hit a low on March 15th. Like New Jersey, yesterday’s total was actually down a bit but one point does not make a trend. Still, the increase from the low here is 12.2% which is way behind the 40.9% increase in Michigan over the same time period from the low. Not a lot of concern here.
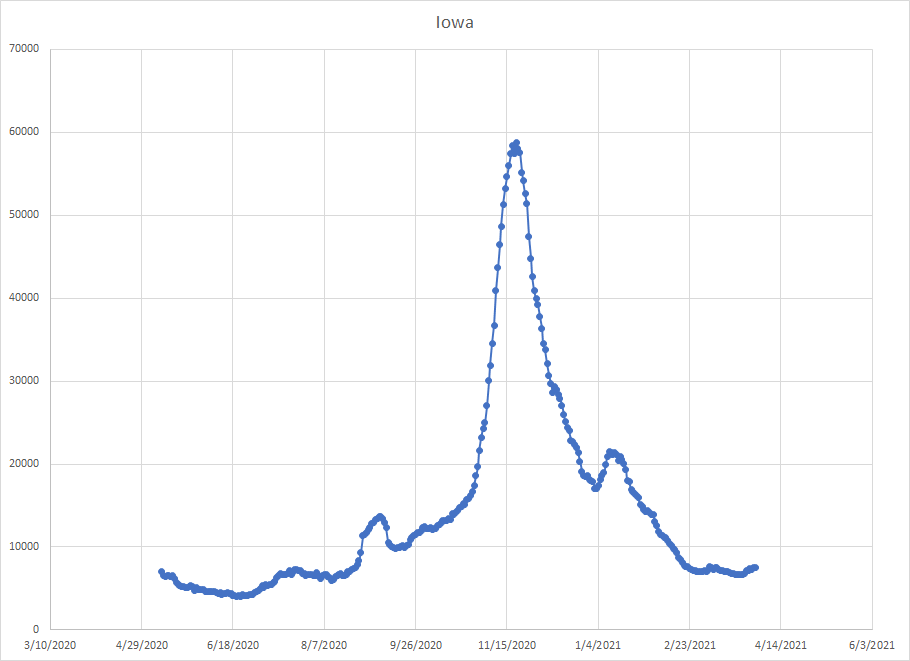
In Iowa, cases have picked up just in the last weeks. I really don’t want to make a comparison based on a single week.
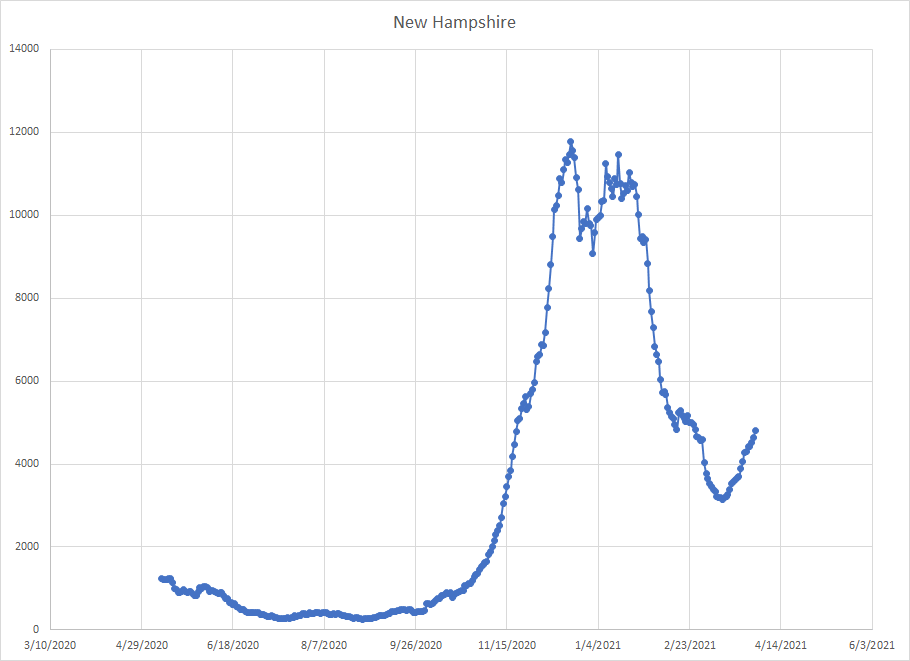
For the month, New Hampshire doesn’t rank that high but that’s because it hit a low on March 13th and things have been increasing since then. Over the last half of March, the total is up 52.5%. In Michigan, over the same time period from the low, the increase was 58.5%. Another place we need to watch for two weeks.
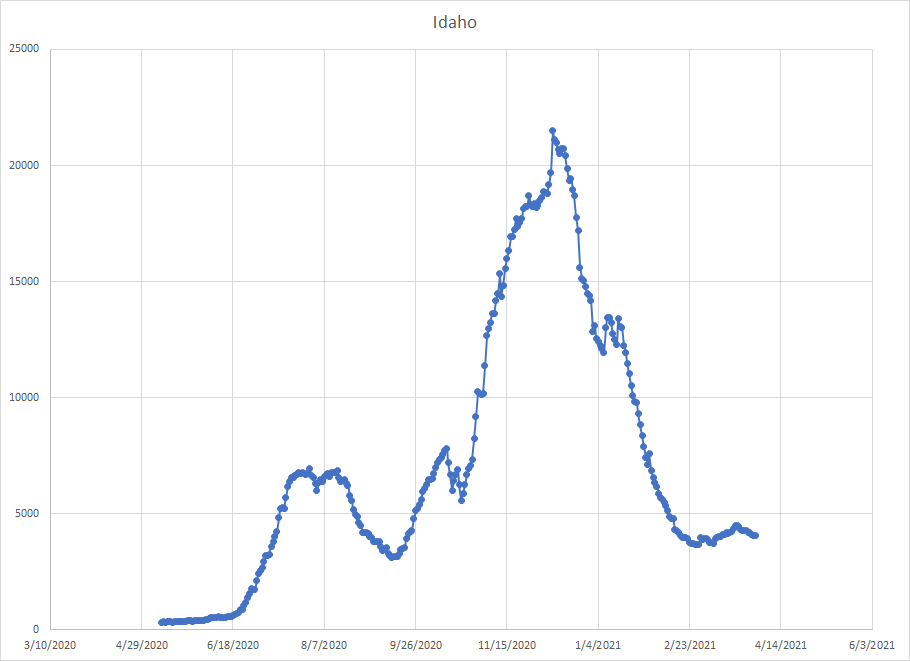
Cases were just barely up for the month in Idaho. There was a small increase in the middle of March but things have been dropping since then.
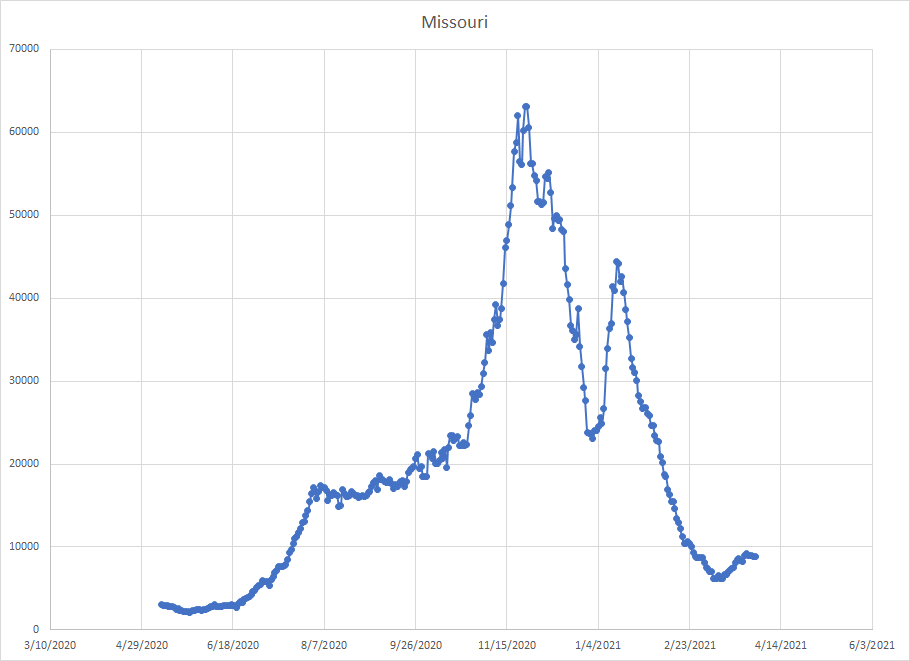
Missouri is another places where cases are just barely up for the month but the pattern within the month is interesting. But I also remember there being a bolus of cases added so that wasn’t a real spike.
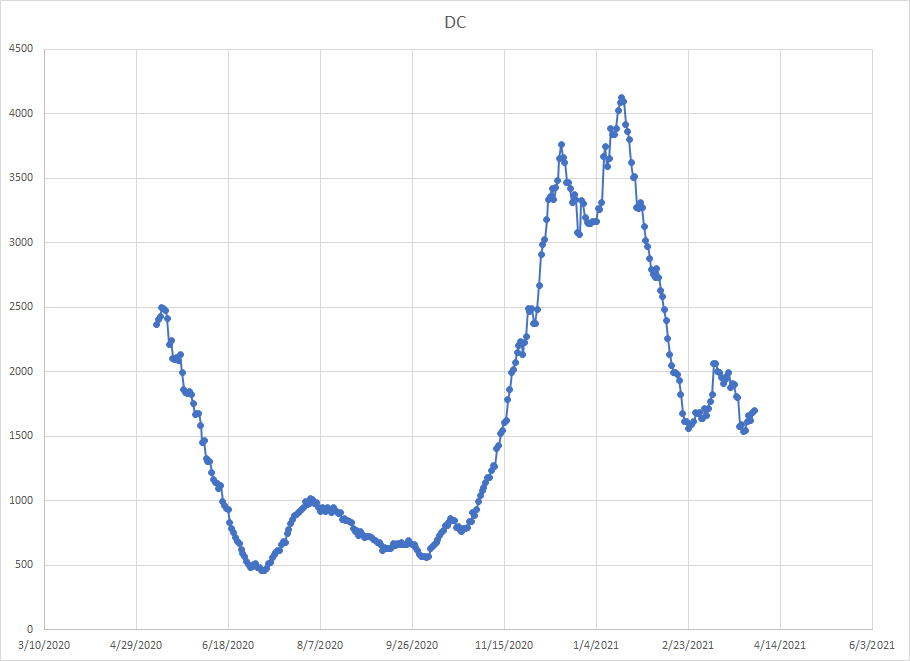
DC is the last place where we saw an increase in March and, again, it was just a very small increase. There was a week in March where cases were up 26% but it didn’t sustain and they ended March almost where they started.
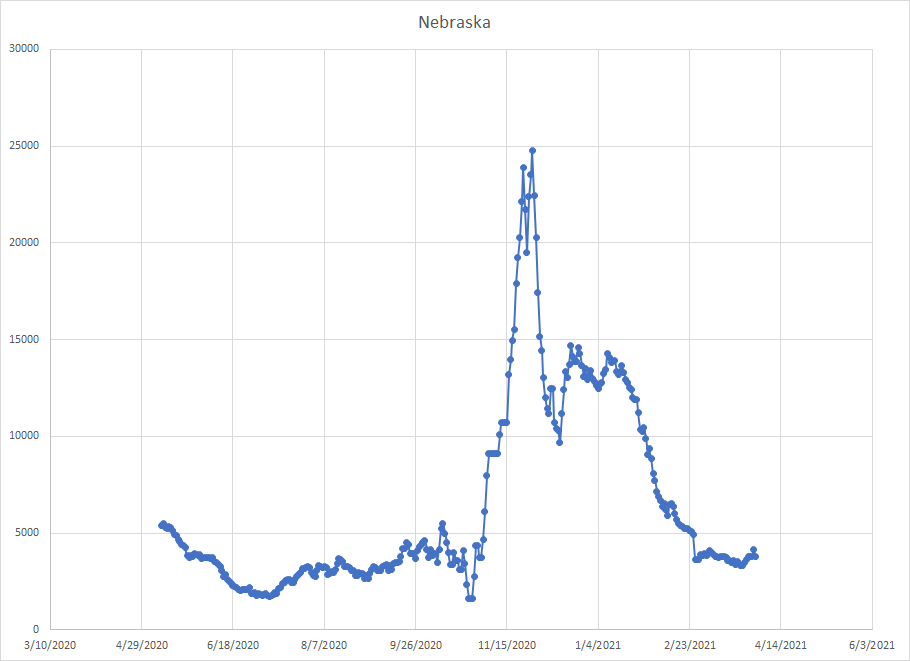
Nebraska was basically flat for the month of March.
There has been a slight turn up in Indiana since the low on March 20th. But cases are only up 13.6% since then compared to a 25% increase in Michigan over the same time since the minimum. Despite sharing a border, the pattern isn’t the same right now.

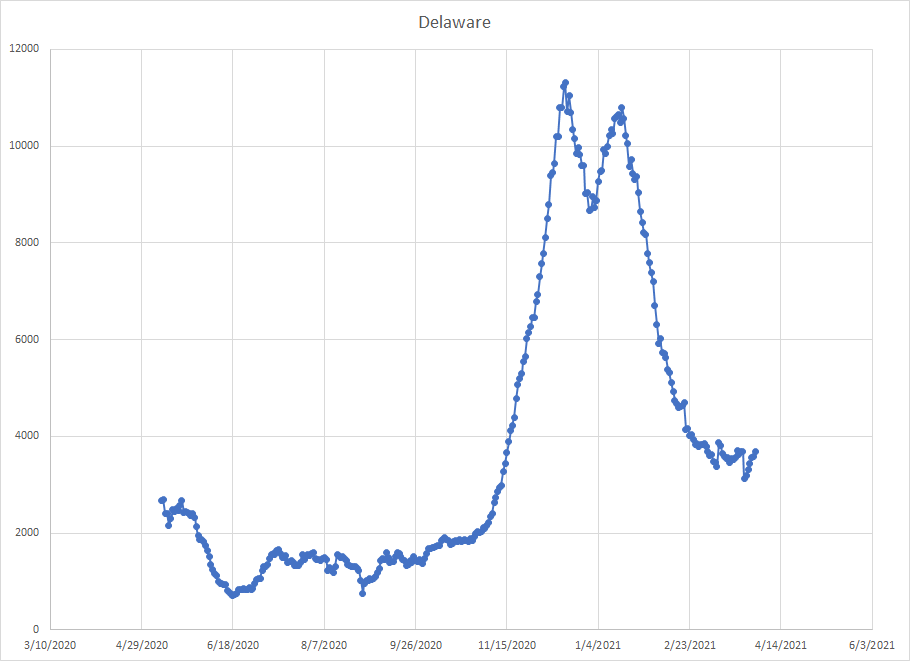
Some twists and turns but Delaware was basically flat over the month of March.
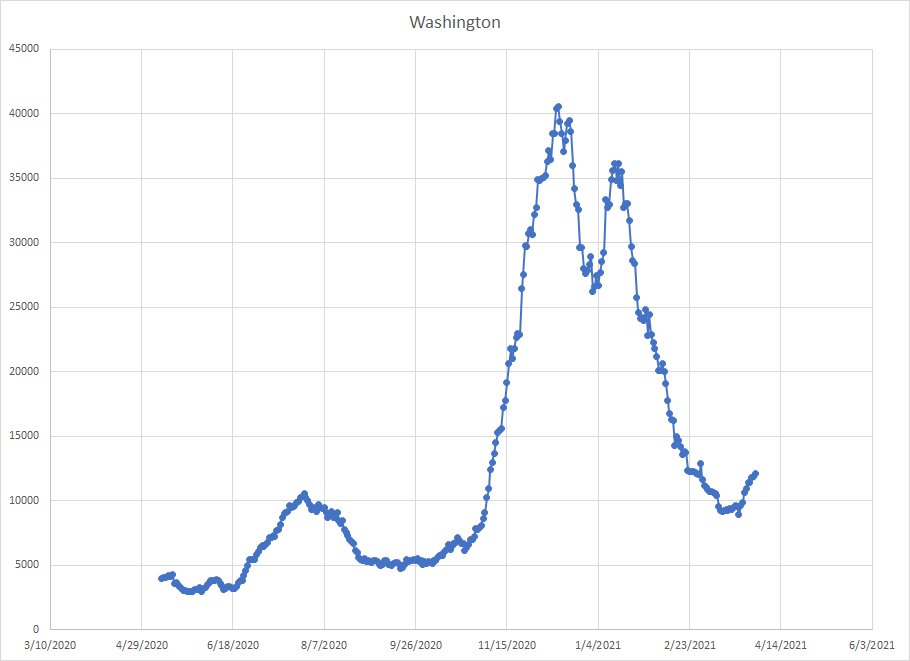
Washington’s recent increase is pretty big. They are down for March, but cases fell until the 22nd and have been on the rise since then. It is only nine days, but the sum is up 35.8% which is above where Michigan was nine days after the low there (25.3%). A place that needs to be watched.
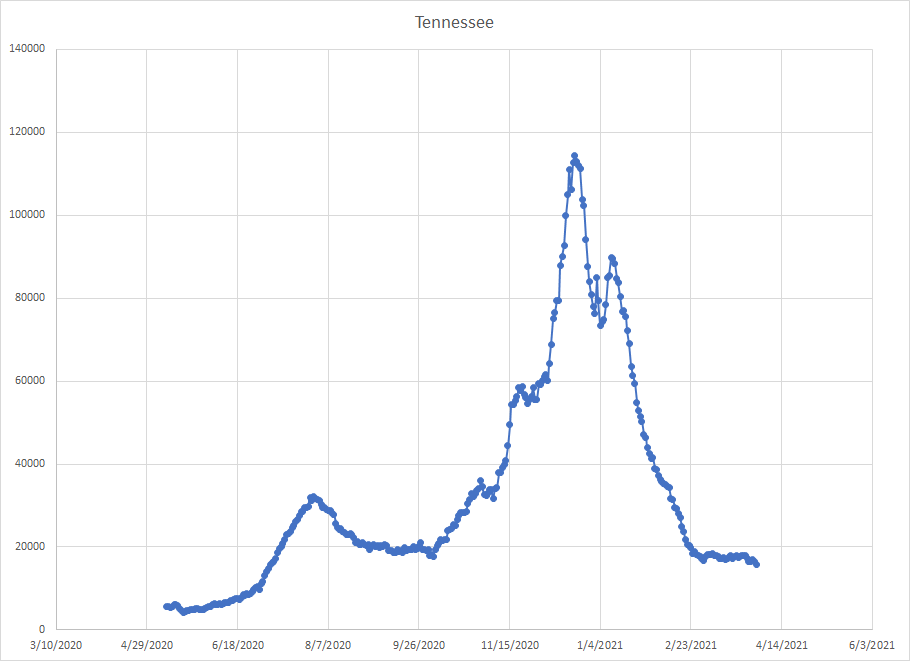
In Tennessee, cases were flat until the 26th and have been dropping since then.
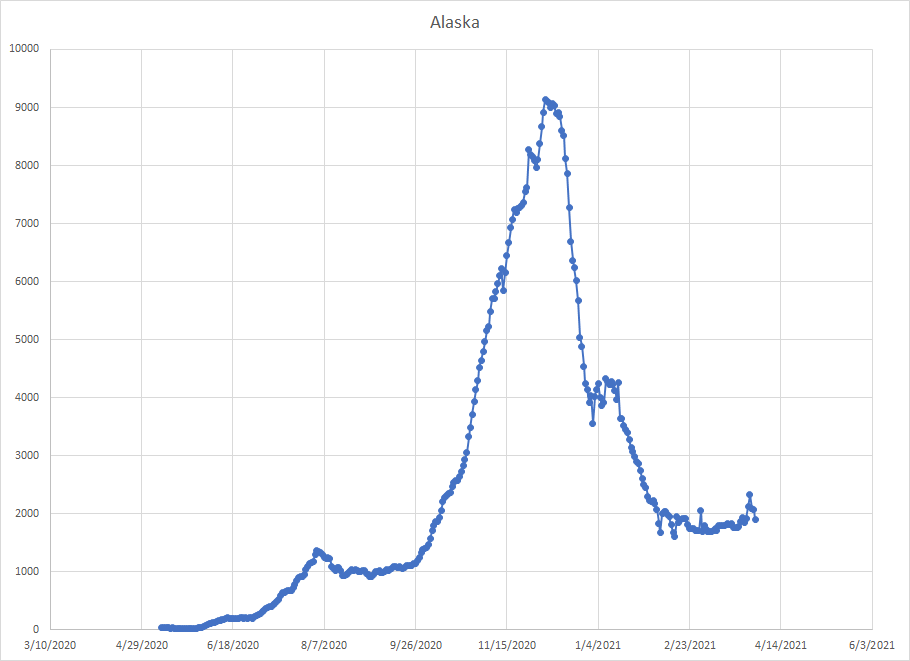
Alaska saw some ups and downs but ended up slightly down for March.
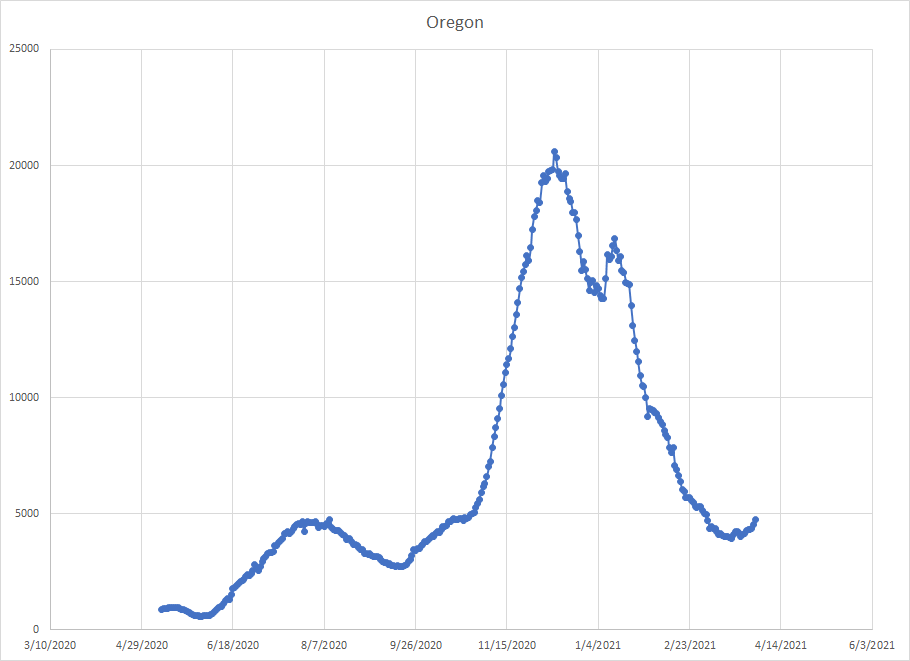
Oregon is like Washington. Cases were down over the month but we’ve seen things trend back up over the last week. Have to watch and see if the increase continues.
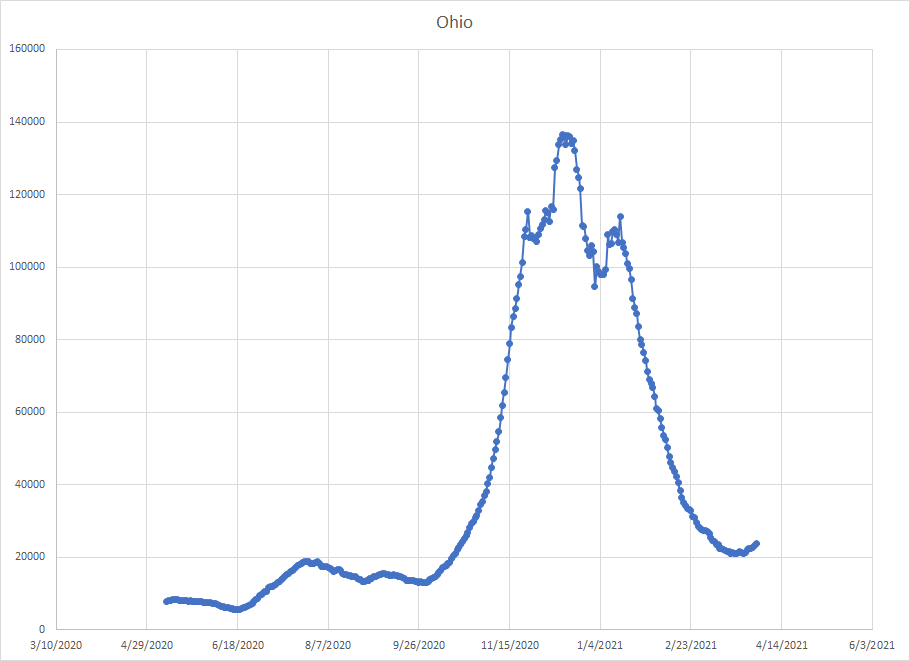
Ohio is another places where cases were down for March but we’ve seen things start to creep back up in the last week. One week of data isn’t really enough to speak intelligently about future trends so we just have to see how it plays out.
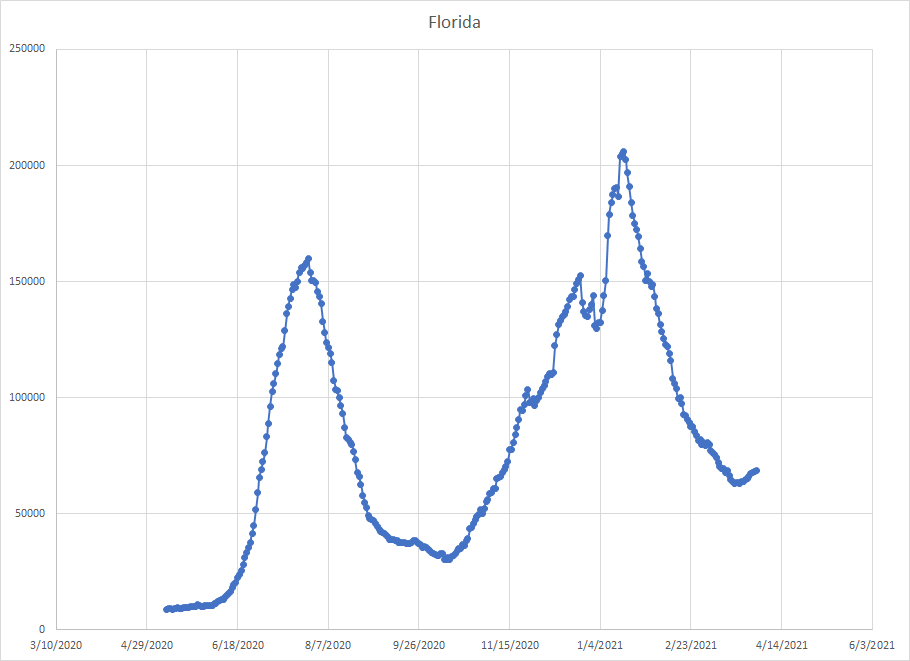
Despite the separation, Florida is similar to Ohio with cases down for the month but picking up in the last week or so. The low was on March 22nd. While this is still early, Florida is somewhat controversial so I think it is fair to point out that cases were up 9.2% for those last ten days. In Michigan, the increase was 19.0% for the ten days after the low. Yes, things are slightly up, but there are a whole lot of other states that are more concerning than Florida right now.
Things dropped from the beginning of March to a low on the 14th. Then, they increased until the 26th although not getting back to the high on the 2nd. And they’ve dropped since then and are down for the month.
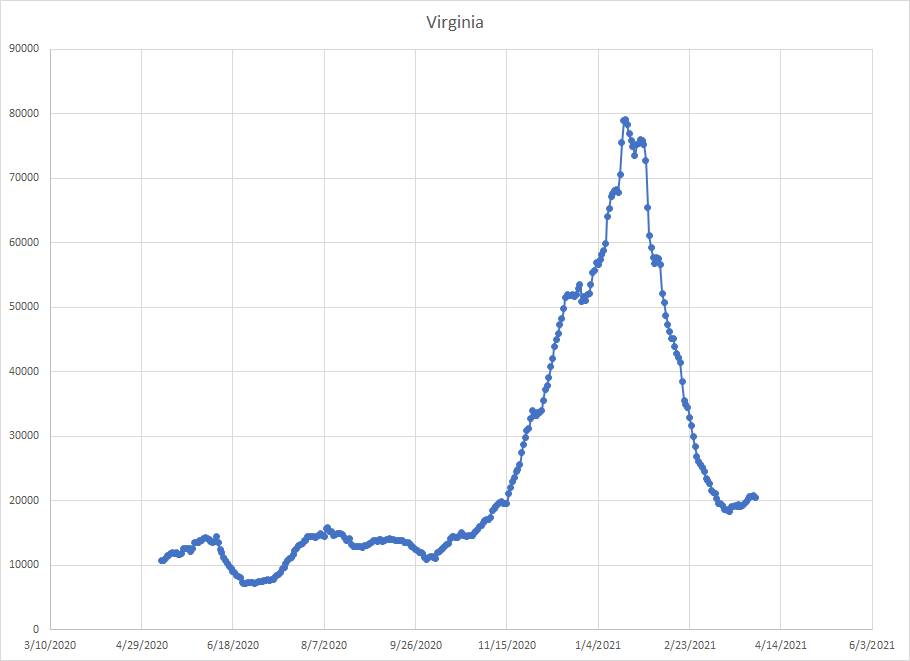
Things were falling as March started and Virginia hit a low on the 17th. While cases have come back a bit, the trend hasn’t been strictly upward and they are only up 11.7% from the low. Far below Michigan which was up 35.1% at the same time after their low.
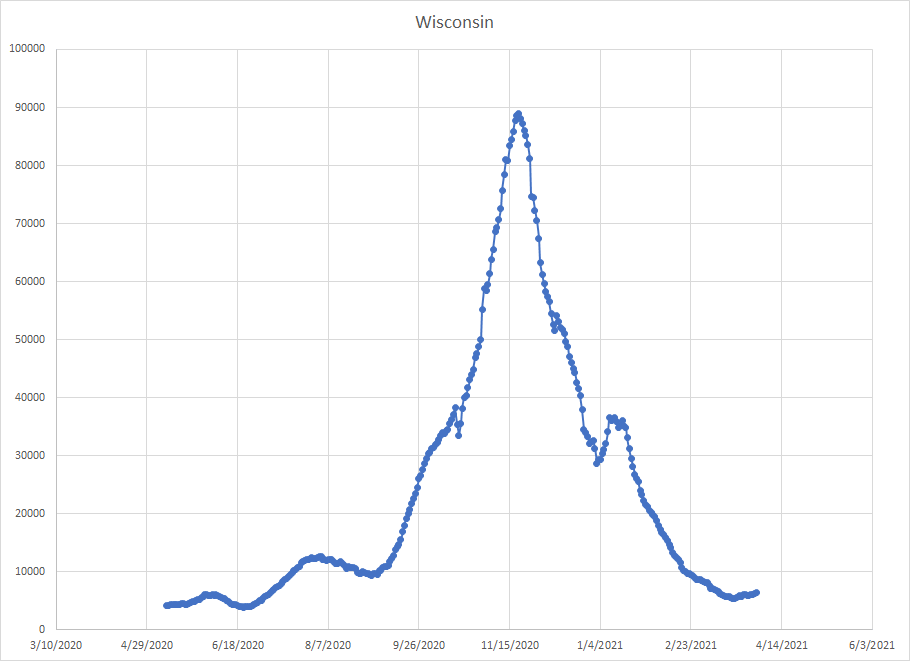
Wisconsin hit a low on the 18th and cases have started to come up a bit and are up 19.5% from the low. At the same time after their low Michigan was up 33.1%. So the current trend in Wisconsin is not like either Michigan or Minnesota. They kind of stand up among the states in the upper midwest.
Cases in Nevada were flat to slightly up until the 19th and have been dropping since then.

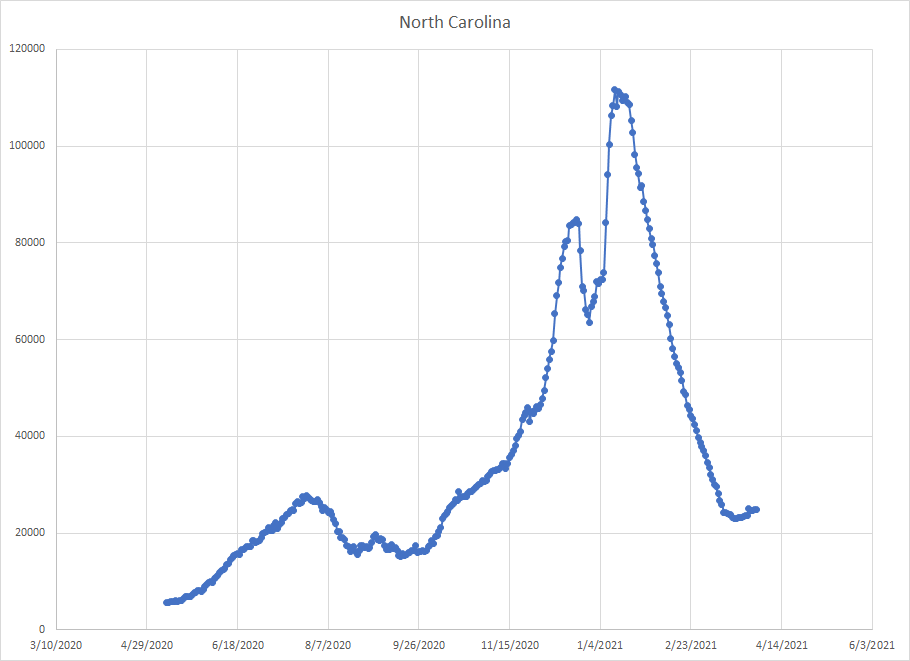
In North Carolina, cases dropped until the 19th but have been flat to slightly up since then. The increase to the end of the month is 7.5% which is far below the 31% increase in Michigan at the same time since their low.
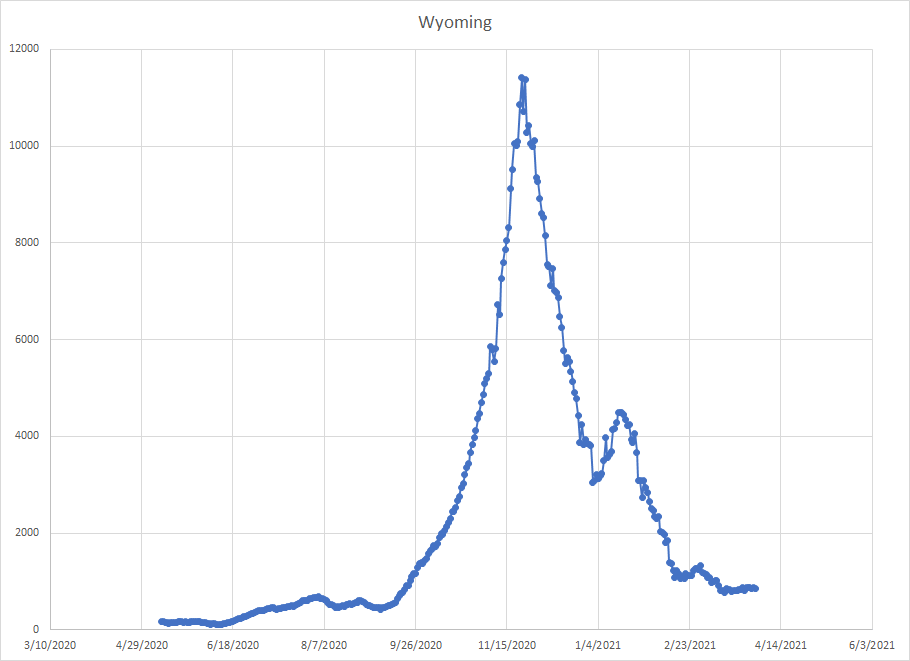
Cases in Wyoming stopped dropping on about the 14th but after increase a bit, they’ve been flat for the last half of March.
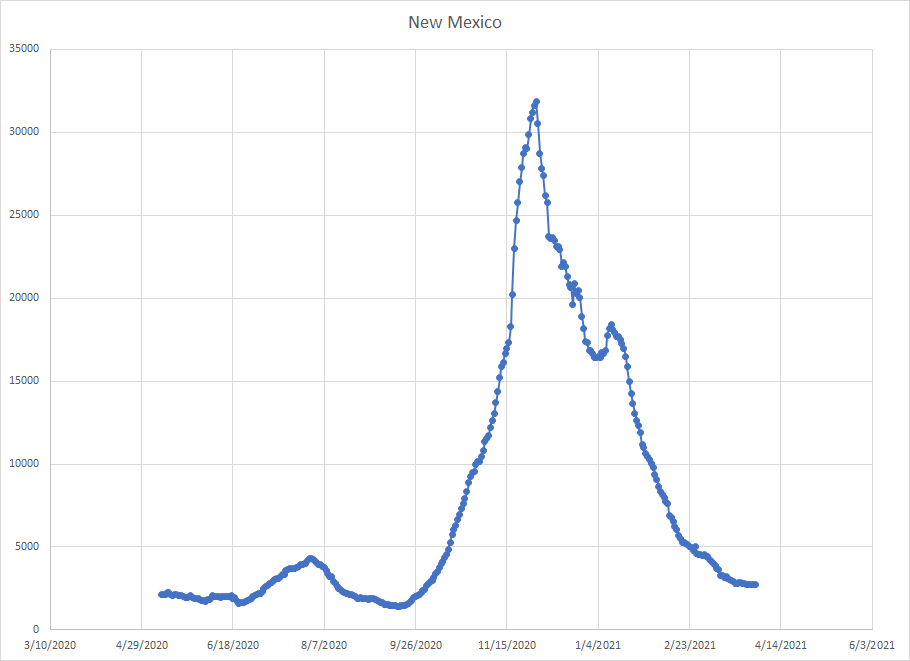
In New Mexico, cases declined until about the 24th and have been flat since then. We are getting to states where there is no clear uptick or where cases are still falling so these are the places where there is little concern.
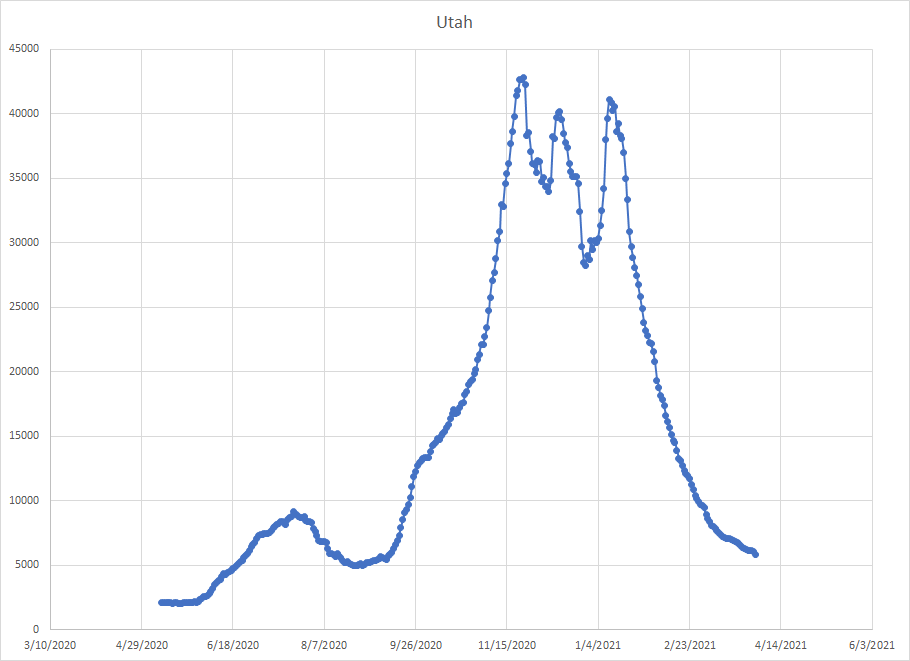
Cases are still going down in Utah.
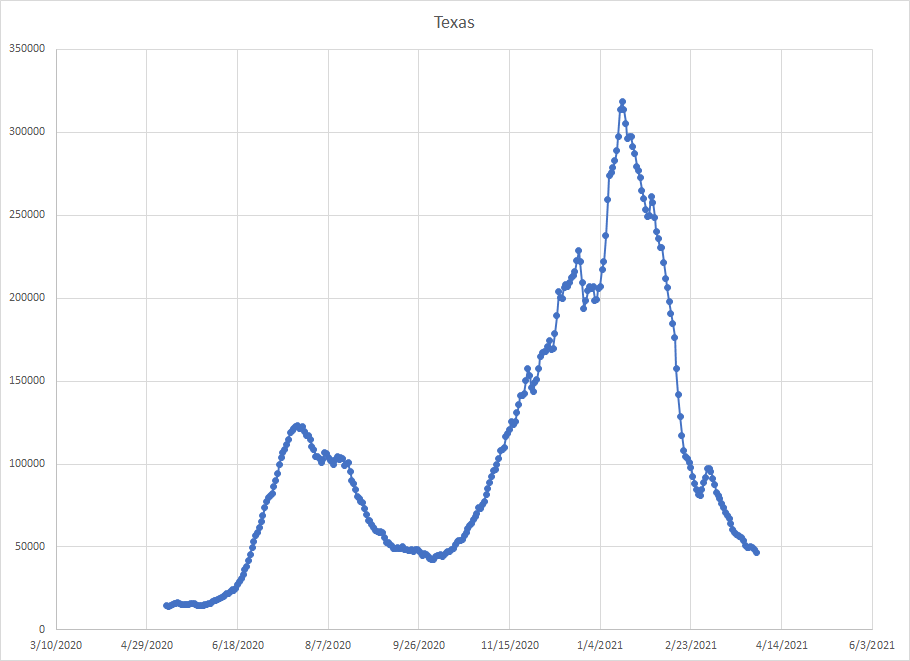
Another controversial state but cases in Texas continue to go down.
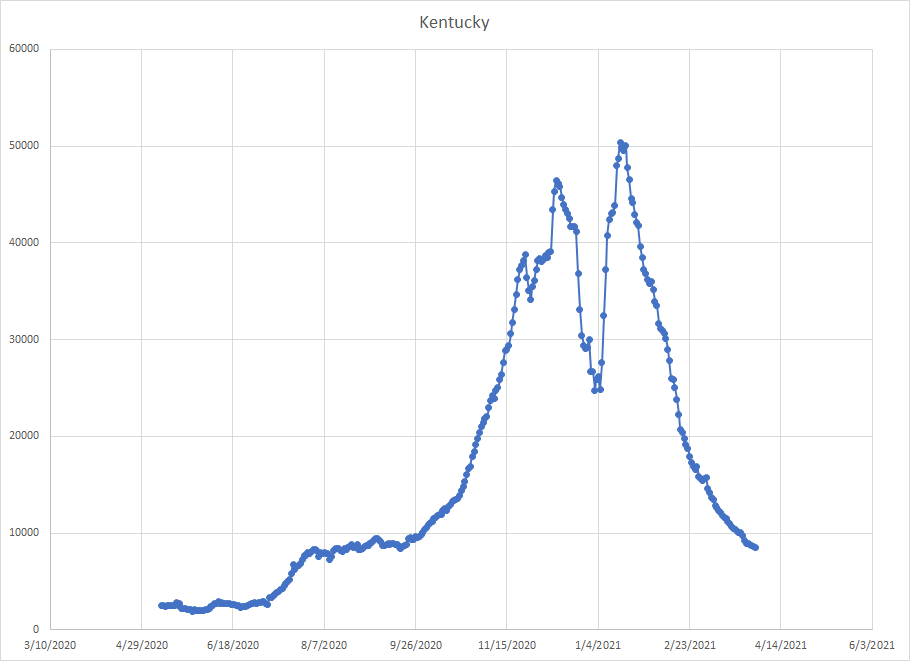
In Kentucky, cases also continue to go down.
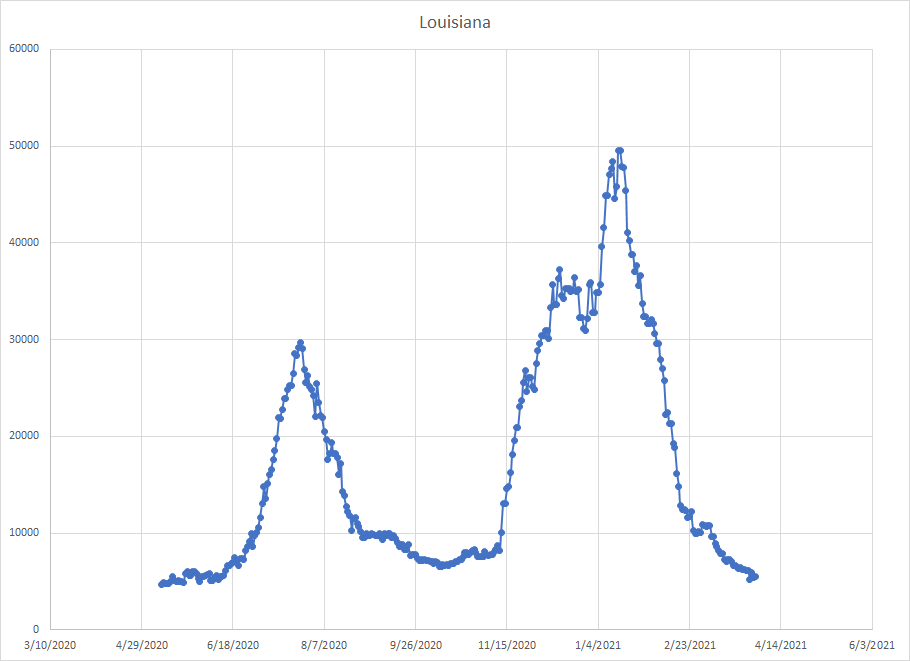
Maybe things are starting to flatten in Louisiana but cases are down from the beginning of March.
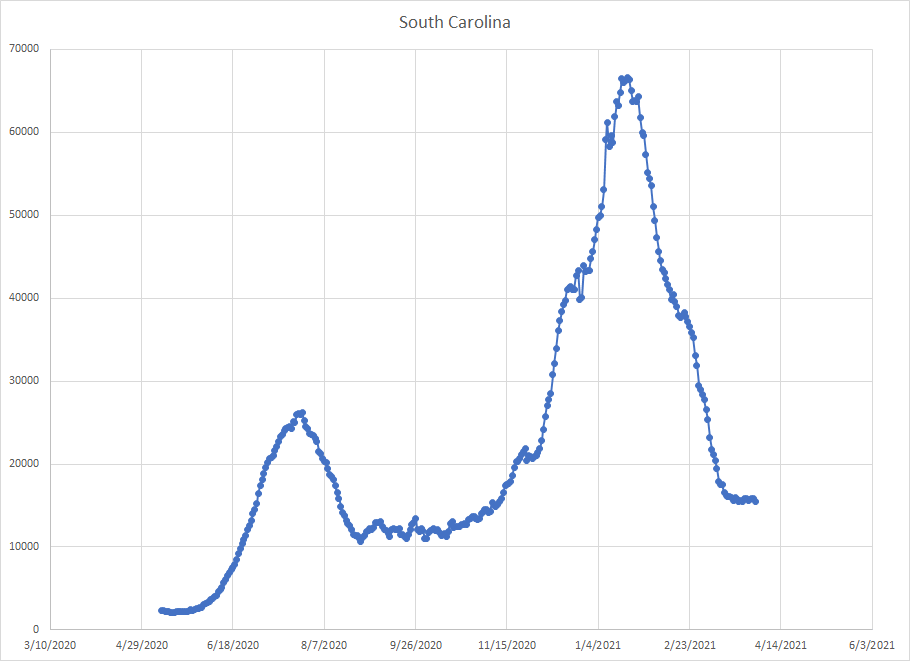
Really the same story for the entire South where cases are down. Things seem to have flattened a bit in South Carolina but no sign of any increase.
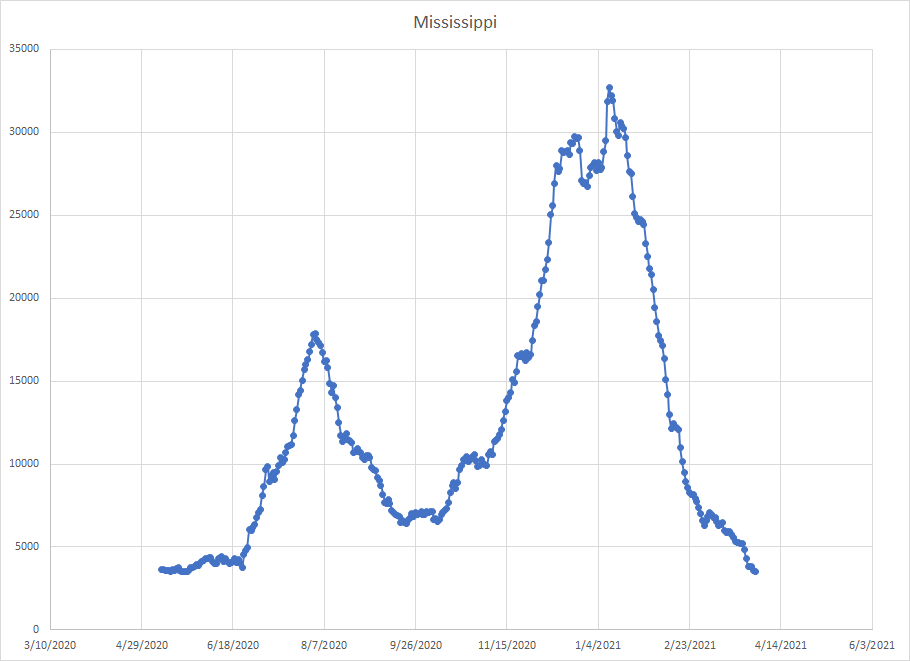
Cases continue to fall in Mississisppi.
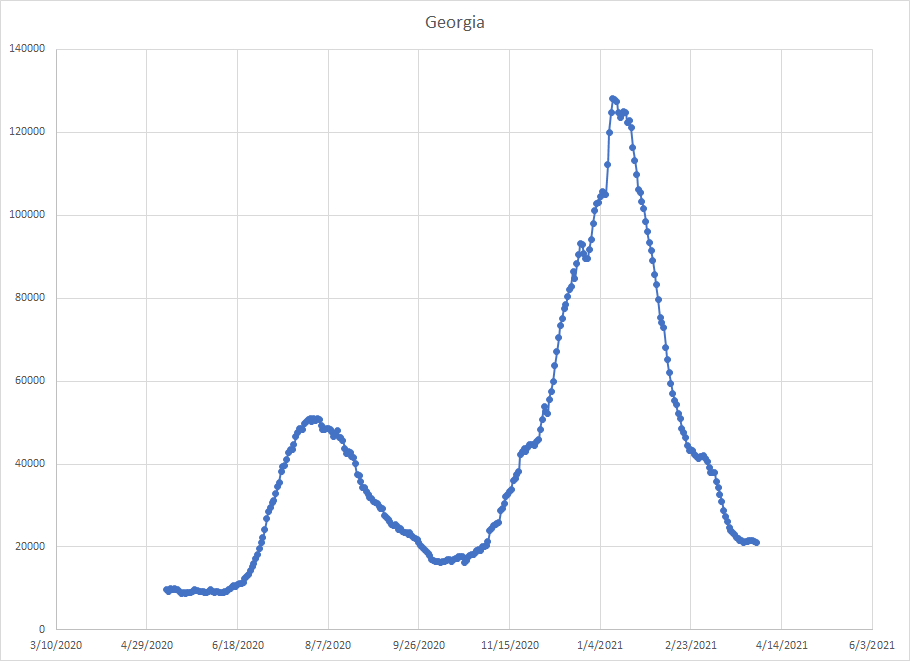
Cases have been flat in Georgia since the 24th.
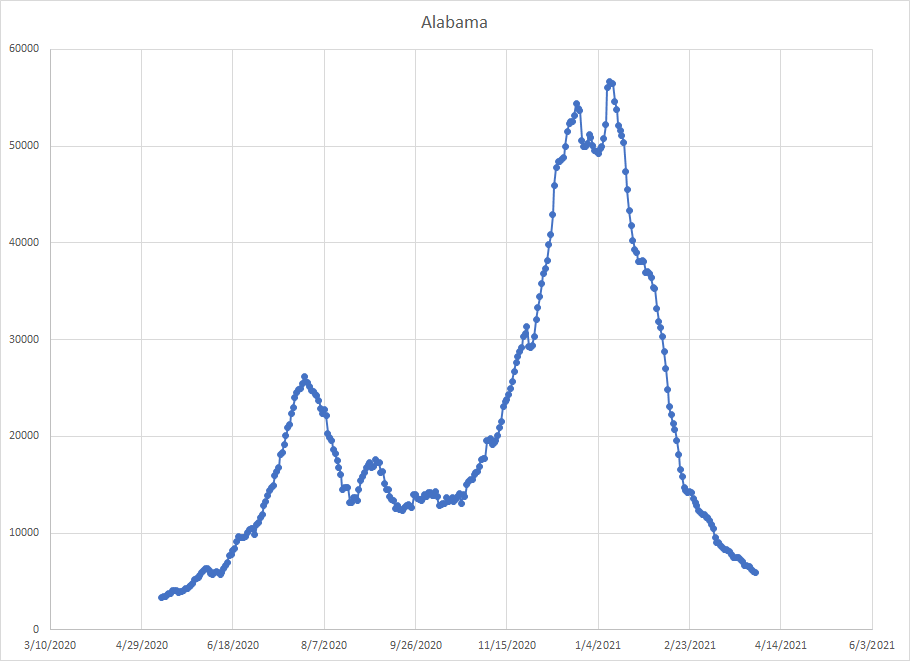
Things continue to fall in Alabama. (Yeah these comments aren’t very interesting but there isn’t much to say.)
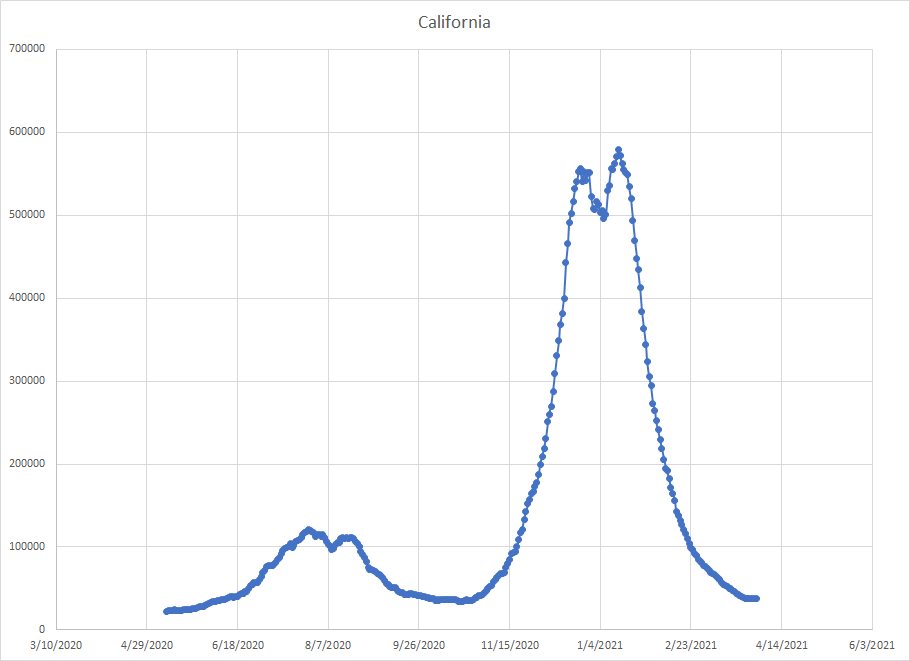
Things have flattened in California since about the 26th.
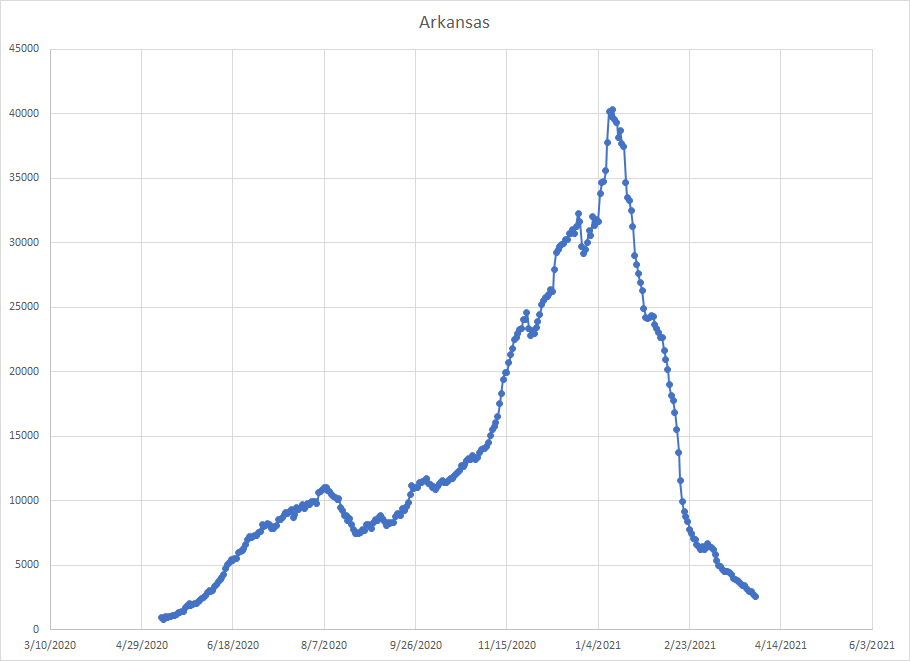
Cases still going down in Arkansas.
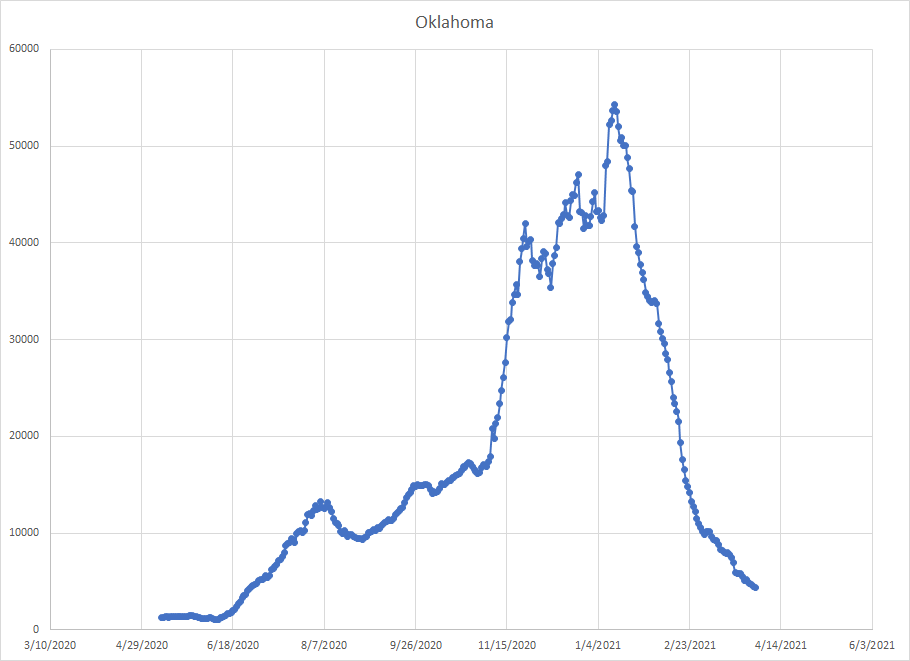
And cases continue to drop in Oklahoma.
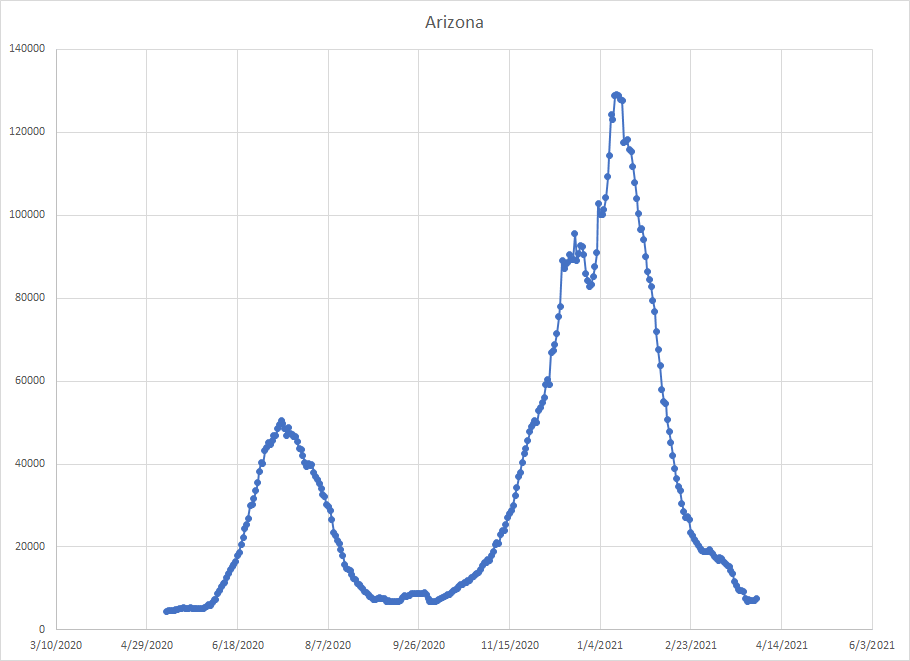
Cases look to be flat in Arizona since about the 26th.
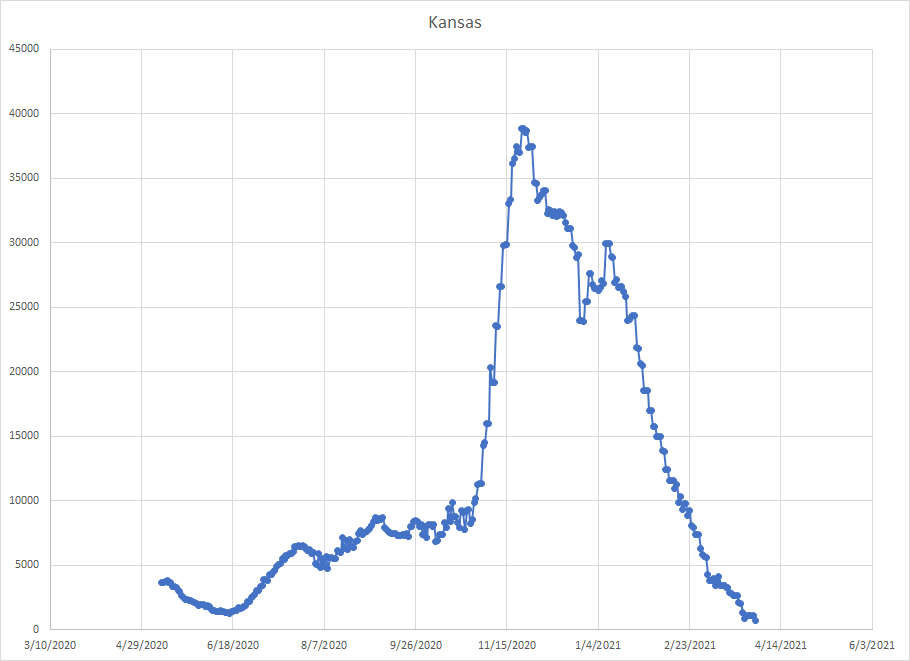
Kansas I don’t trust. I don’t know if they’ve just stopped reporting or if the WorldoMeter site is neglecting to update their data. They’ve always been the worst at reporting. I’ll probably have to go to the state site and see what I can find but I think cases are down here.
Did you make it to the end? Did you find your state if you live in the USA? In broad term, the South is doing great. Most of the states that lie below 40 degrees latitude are not seeing increases. The upper Rockies (Wyoming, Idaho and Montana) are also in good shape. Michigan is the biggest problem area but there are some other states in the North that need to be watched. The Pacific Northwest is a bit unsettled right now as well (in terms of where cases may go).
I’m not going to make any predictions. In two weeks, we could have several places looking like Michigan or maybe only still Michigan. We also need to see things start dropping in Michigan to start making a guess as to how severe this might get.
