
For the record, I have a degree in Statistics which just means I’ve always been in to data and analysis and trying to make sense out of it. When everything shut down a year ago and there was nothing else to do, I found the WHO site which was tracking corona cases on a daily basis. So I started creating my own database from that site and it has just continued to grow.
Over this last year, I’ve learned to try to not be too quick to declare victory because it seems like the next wave is just around the corner. Of course, the reverse is often true as these waves are somewhat predictable and usually have peaked when the media declares a place a disaster.
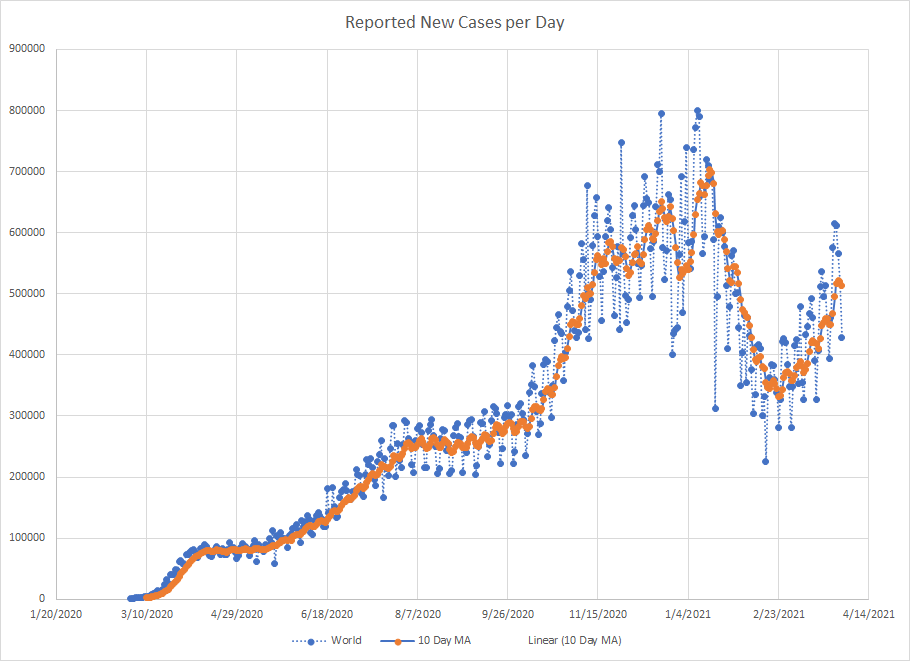
As we are near the end of March, it seemed like a good time to just do a mini recap. One of the things I’ve used from the start is a ten day moving average of cases. It works best in places where reporting is done on a regular basis. There are several countries that report less frequently like once a week or so and then the averages tend to be less useful.
Anyway, this first graph is for the entire world. the blue lines are actual cases while the orange line is my ten day moving average. There have been three periods where cases increased with each one hitting a new high as the virus spread to more places and testing ramped up so more cases were detected. We had disruptions in the data at the end of the year and then things started falling in early January but have turned back up again. One problem with this type of count is it is going to be dominated by the places that have a large number of cases and the drop in January mirrors what was going on in the US.
Still, it might be interesting to look closer at this latest rise. As I created this database, I was only including detailed data on a country when it passed 5000 cases. That seemed like a large number back in March of last year. The WHO currently shows 222 places with at least one case of the virus. Of those, 163 have passed 5000 cases. If I look at my ten day averages, 105 places showed an increase over March and 57 showed a decrease. Tajikistan hasn’t reported a new case since January 10th so they were at 0 for all of March.
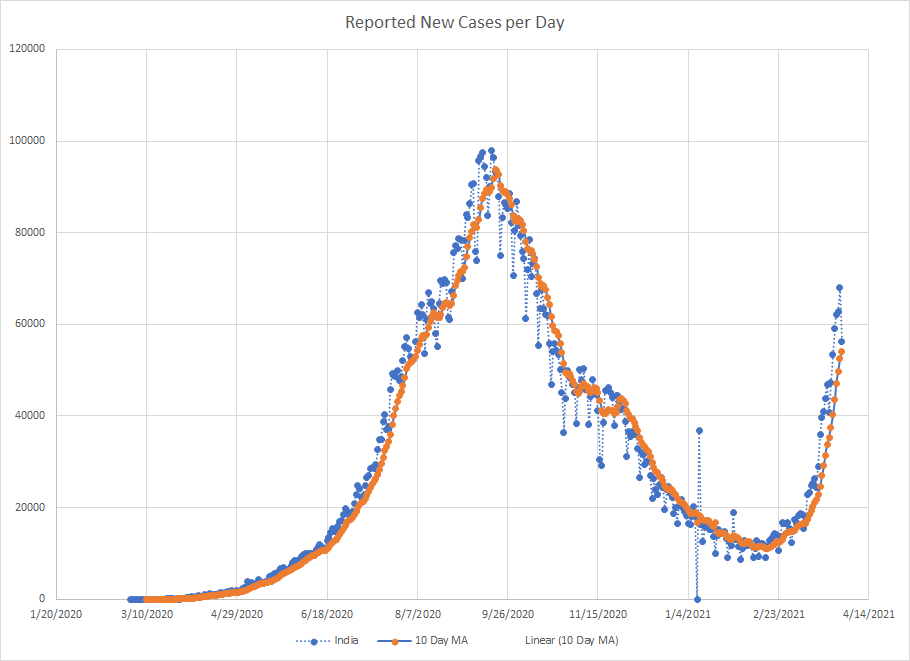
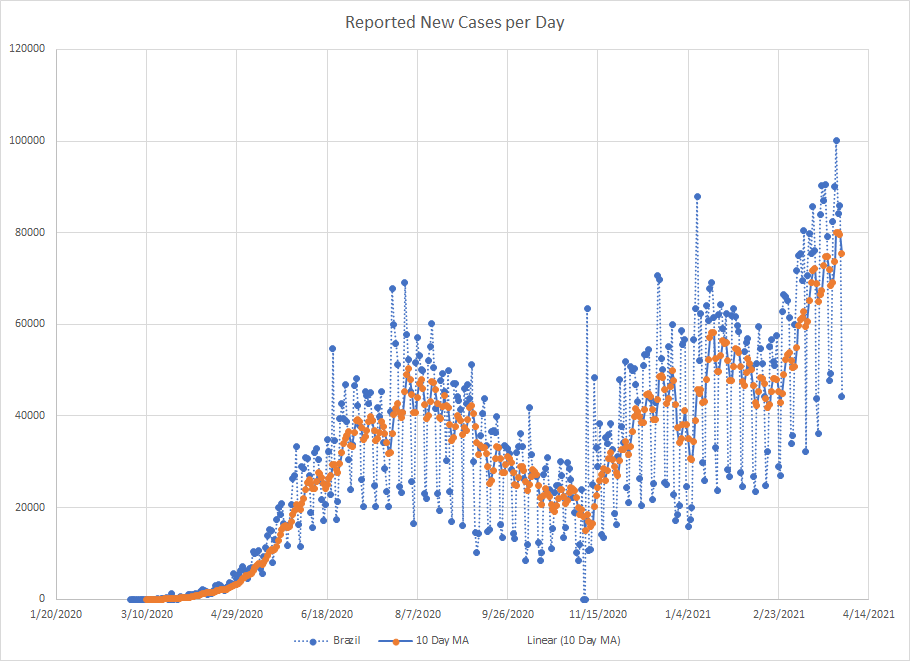
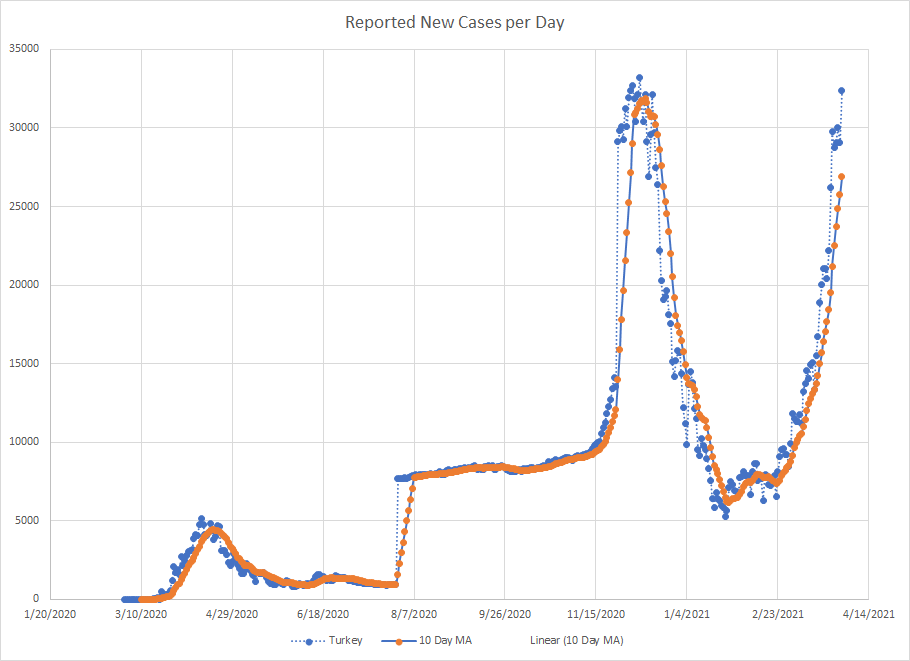
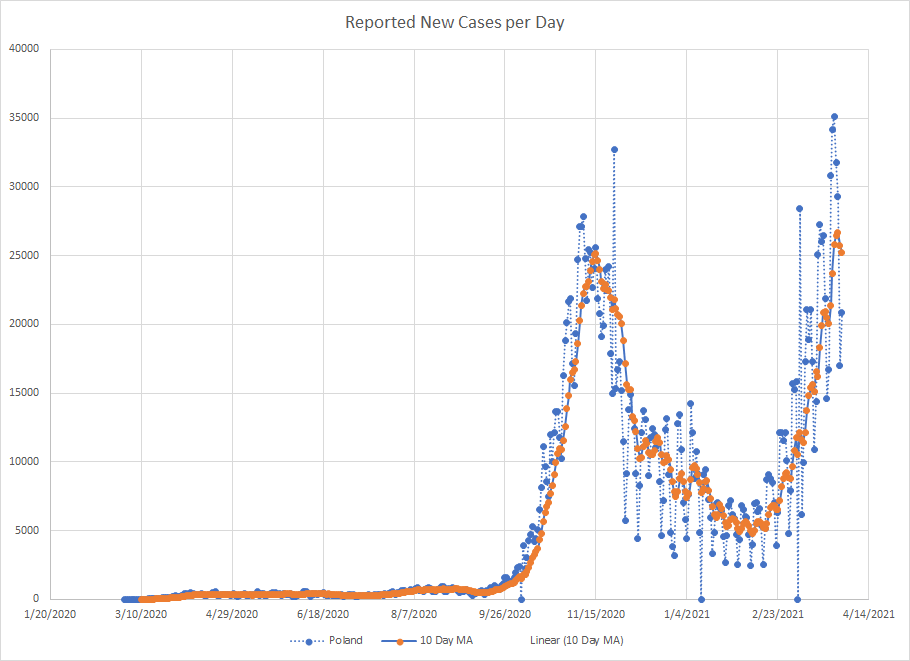
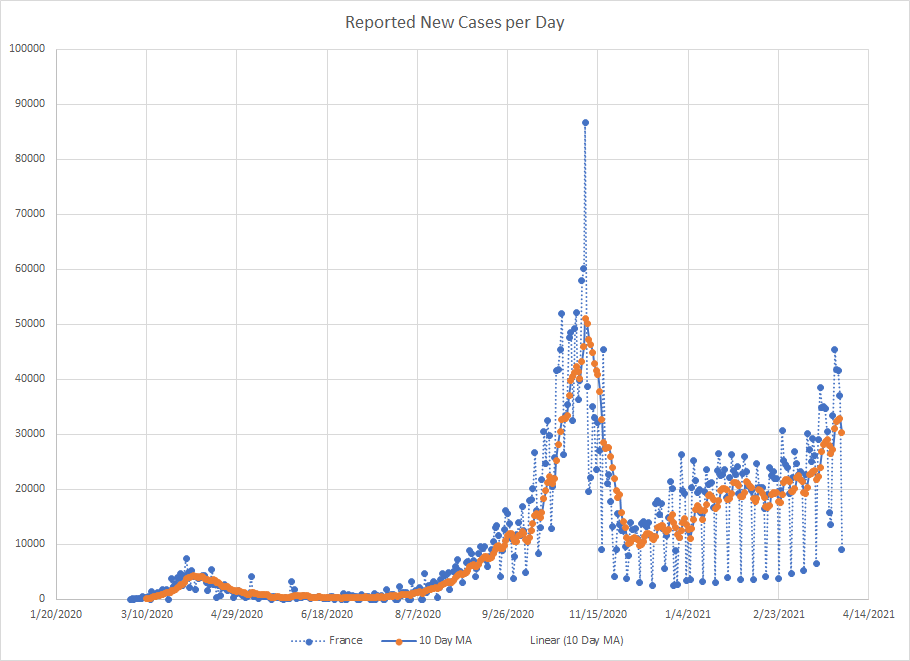
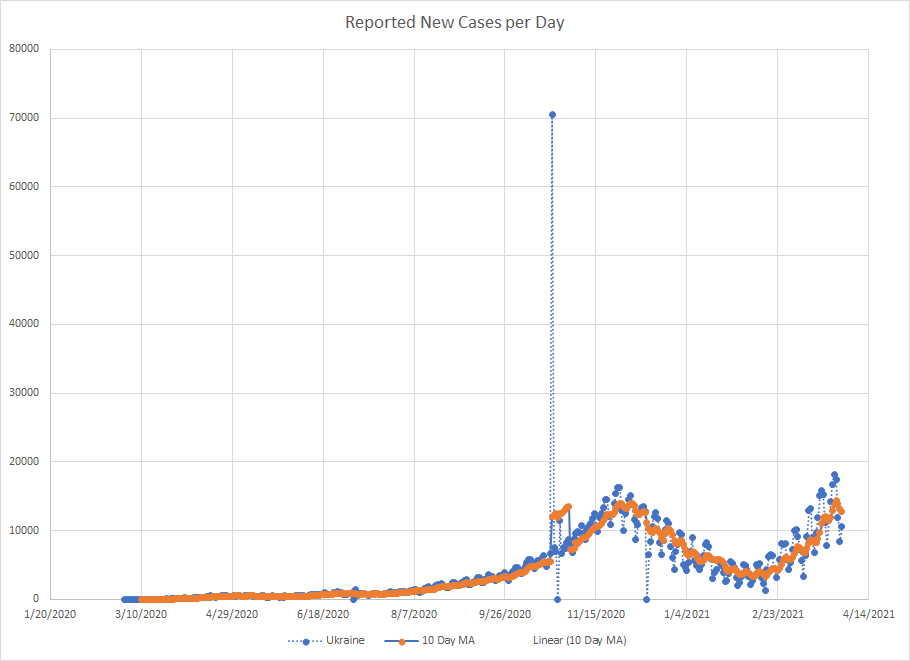
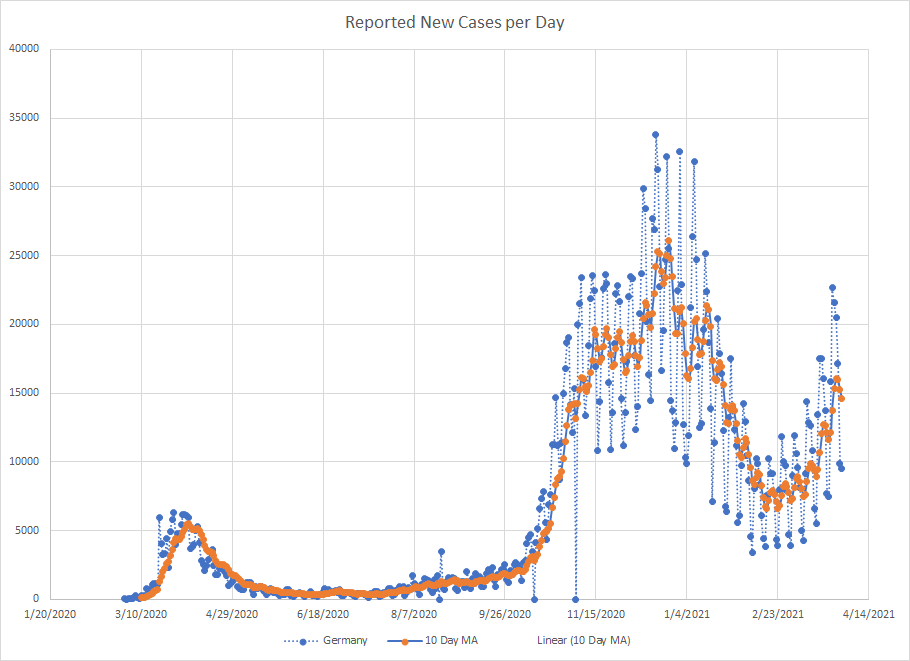
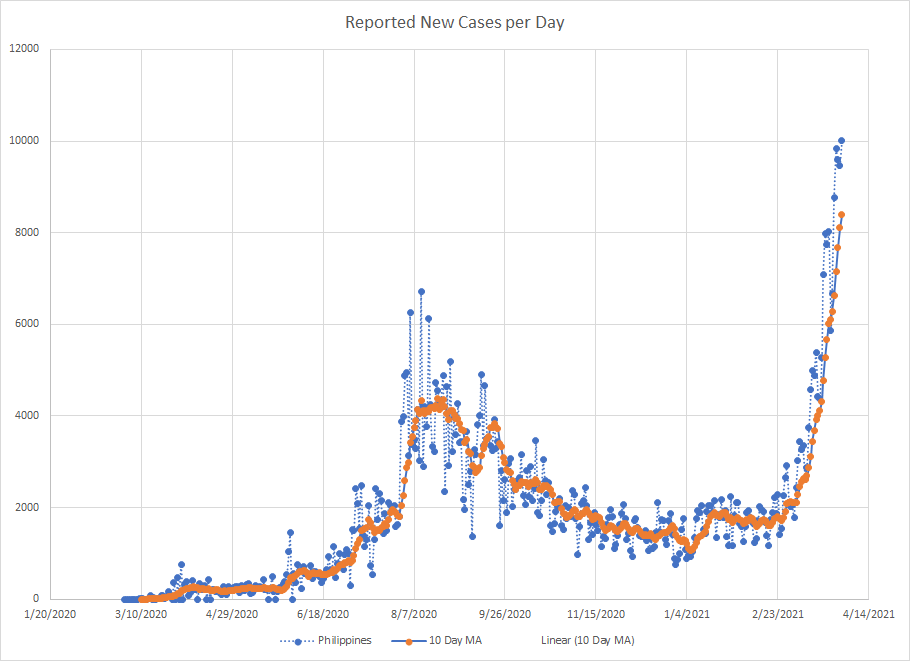
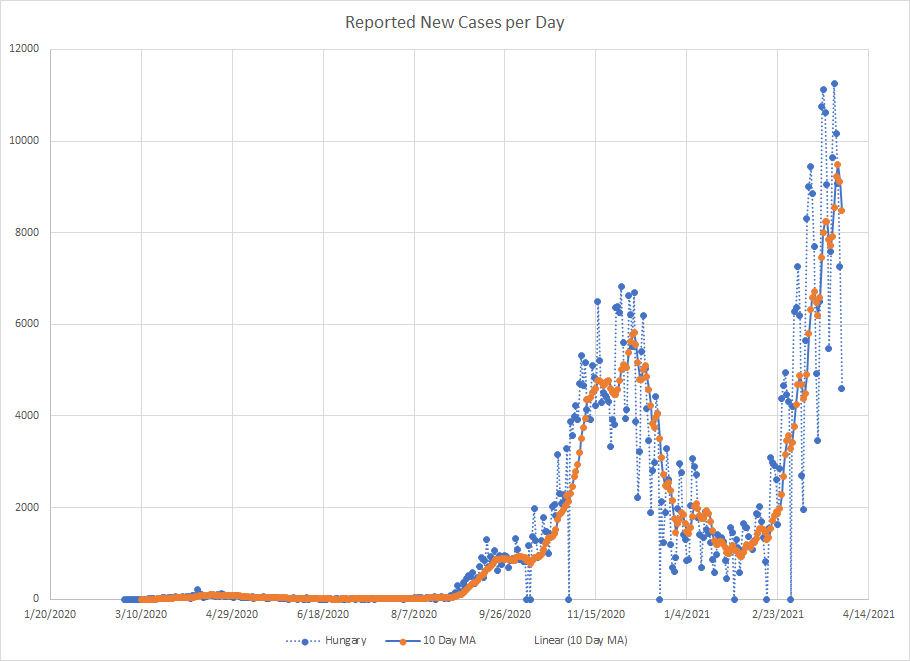
If I look at raw numbers, the ten places that have the biggest increase in cases are India, Brazil, Turkey, Poland, France, Ukraine, Germany, Philippines, Italy and Hungary.
Here are the graphs.
India
Brazil
Turkey
Poland
France
Ukraine
Germany
Philippines
Italy

Hungary
And, because the graph is interesting, I’ll include Jordan which ranked 11th.
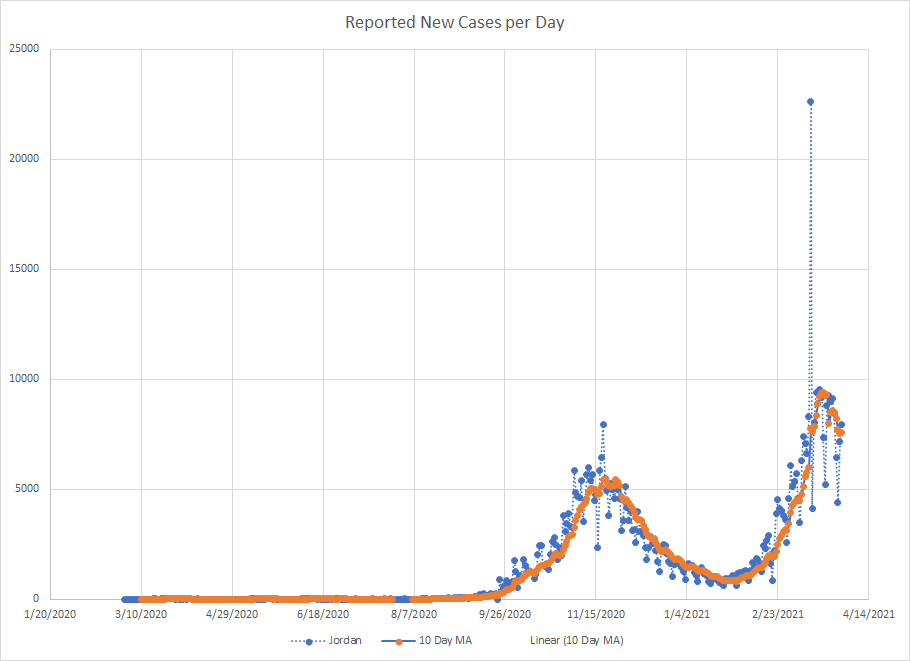
Some of what is going on here is influenced by the one super high day in mid March. But even when that fell out of the average, the results didn’t start falling until a few days after. The trend certainly appears to be downward now meaning that the last wave lasted about a month. While it is still too early to say with high confidence, most of the European countries shown above are seeing down ticks in the moving average at the end of the graph which is about a month after things started to climb. Really need to wait until mid April to know for sure if the trend is really going down.
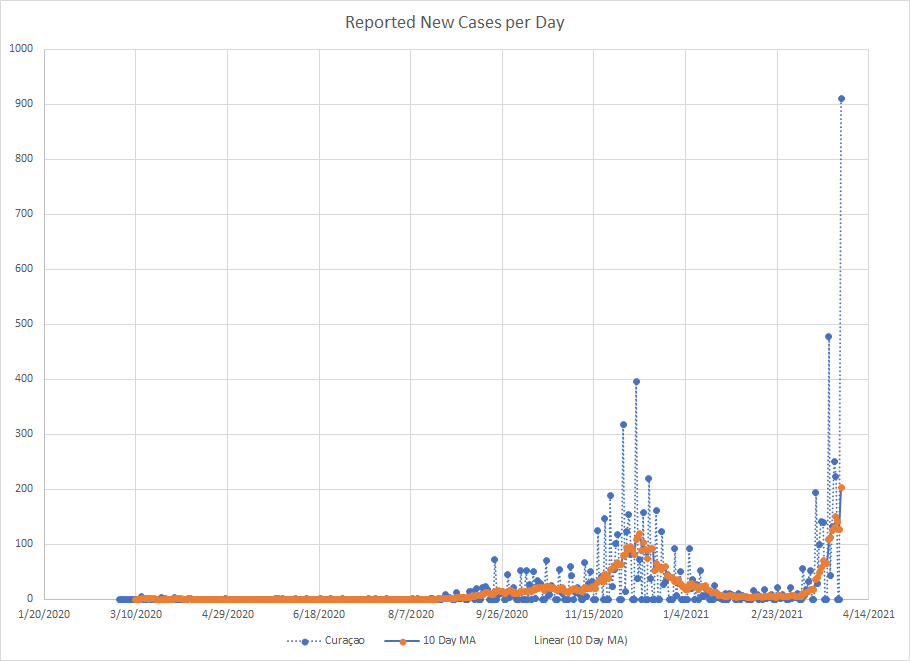
A few more graphs showing places with large percentage jumps.
Curacao
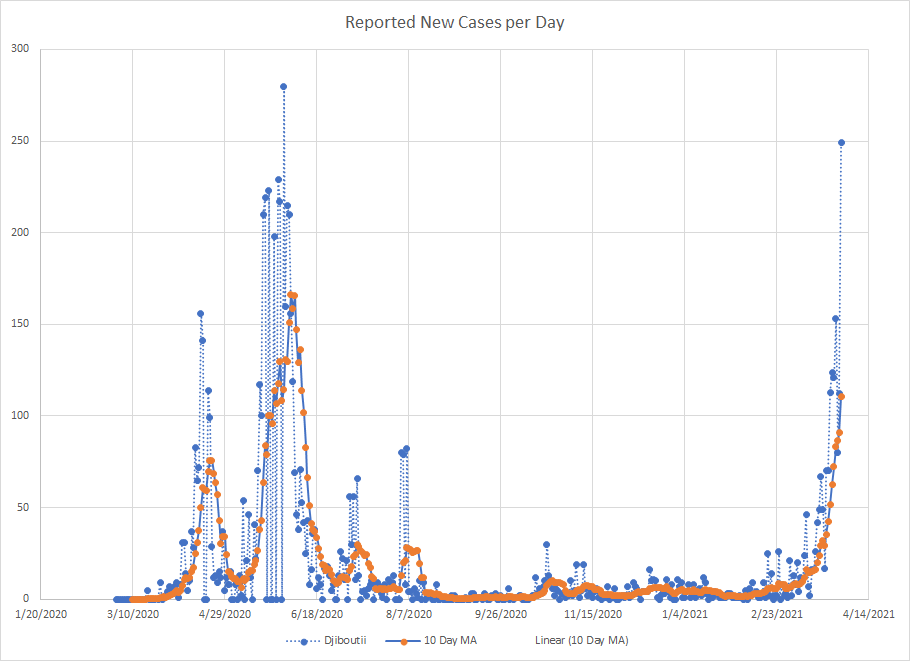
Djibouti
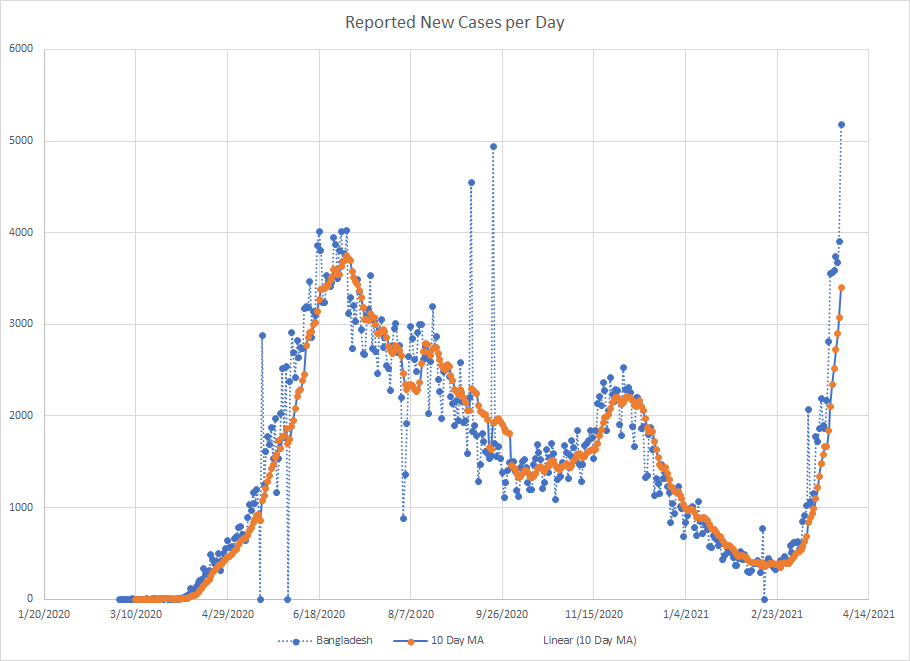
Bangladesh
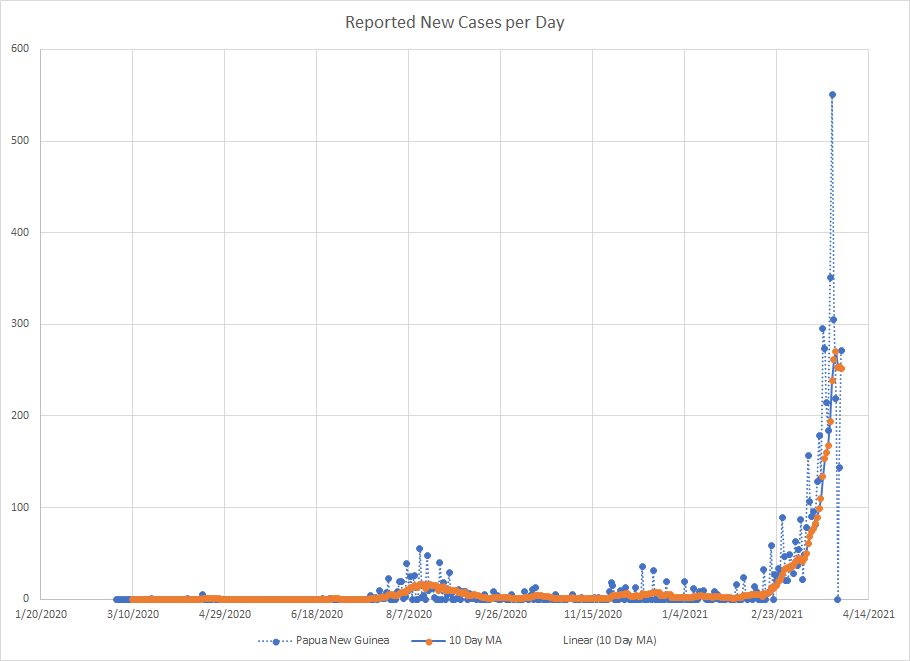
Papua New Guinea
Mongolia
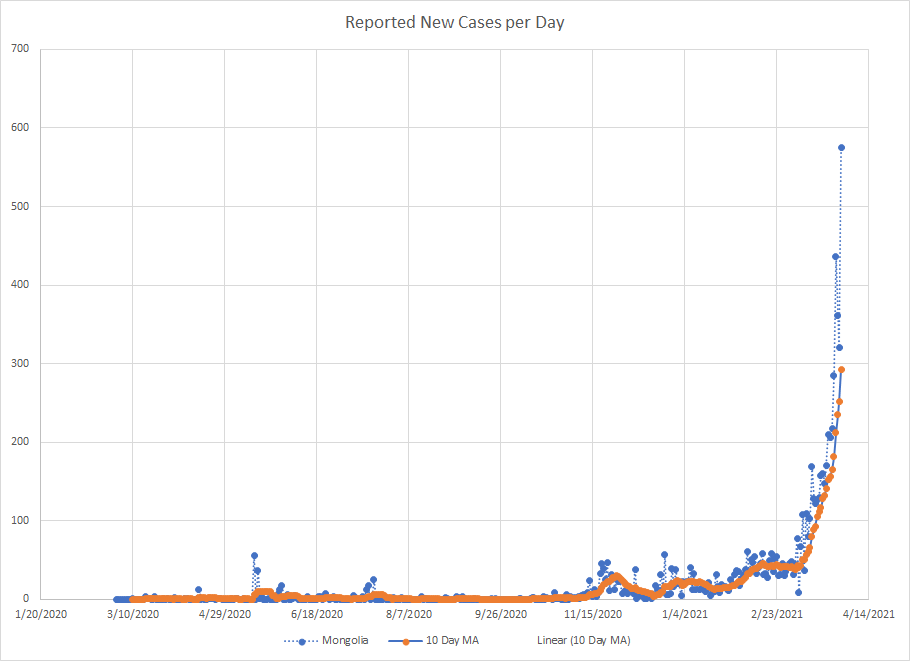
The last two are interesting as neither place had seen a large number of cases until just recently. I’m not going to speculate on reasons because I have no idea. But actually all of them have or seem likely to pass their previous peak.
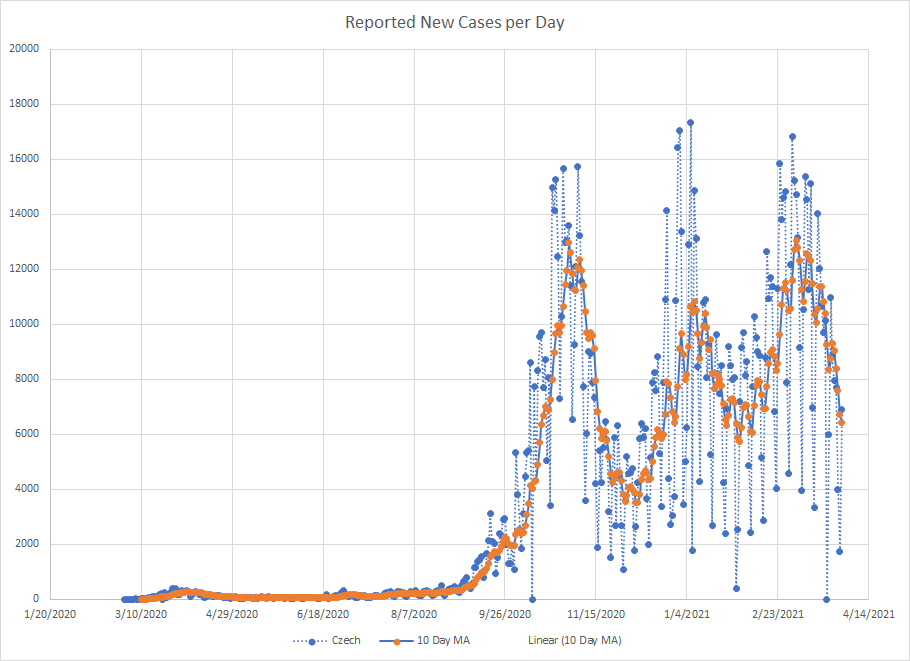
On the other side, the ten places that saw the largest decrease in cases over the month of March were USA, UK, Czechia, Indonesia, Russia, Israel, Mexico, Malaysia, UAE and Slovakia.
Since they sit right between Poland and Hungary which were at the top, let’s look at the two parts of what used to be Czechoslovakia.
Czechia
Slovakia
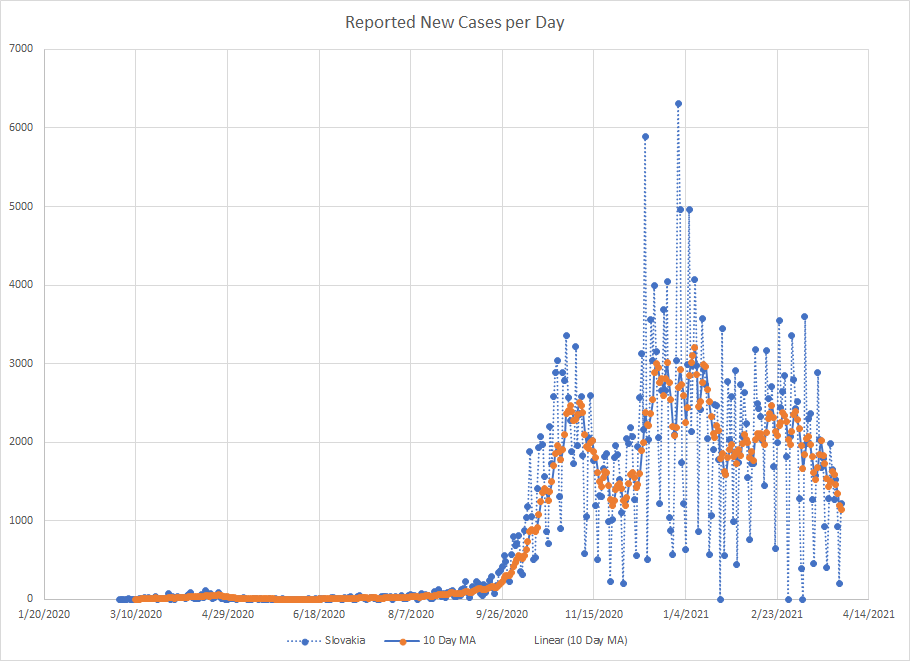
Why Poland and Hungary had much more distinctive waves is a bit of a mystery.
Don’t really have any sort of neat bow to tie around this data. The overall summary is that cases went up in March and more countries saw an increase than a decrease. Nothing is universal as the world doesn’t move in unison. If we hold to past form, we could be close to a peak but it is too soon to say that with any real confidence. Of course, even if cases start to decline globally, they could still be spiking in places.
