

It is time once again for me to look at the numbers and see where we stand with the virus. As the title of the post indicates, Michigan is still problematic when compared to the rest of the country. I’ll go into details later.
For the week that ended on March 20th, there were 9.6 million tests recorded. Again, this doesn’t necessarily mean that 9.6 million tests were run because state reporting can often lag but the trends can still be seen even with this caveat in the results. If I ignore the second week in February where we had weather disruptions, this is the lowest since the last week of October. Still too high in my opinion.
There were 388,485 positive results recorded last week which is up about 1000 from last week when we had 387,539 positive results. Keep this in mind because it means the gains you’ll see in Michigan were largely offset in other states where things are still falling. For the week, 4% of the recorded tests were positive which is now the second week in a row we’ve been under the 4.1% low set in the end of September.
There were 7,751 newly reported deaths making this the second week in a row we’ve been under 10,000 and this is also the lowest number since the first week in November. Again, this is when things were reported and not necessarily date of death.
For the country as a whole, things continue to wind down. As I’ve said before, I don’t know how much lower we can actually go because of the limitations of the testing. And, as states hit a minimum, you’ll see cases rise and fall from week to week. We had 21 states where cases increased from last week so about half the country. A couple need to be watched a little more closely and I can give all the details when we get to the graphs.
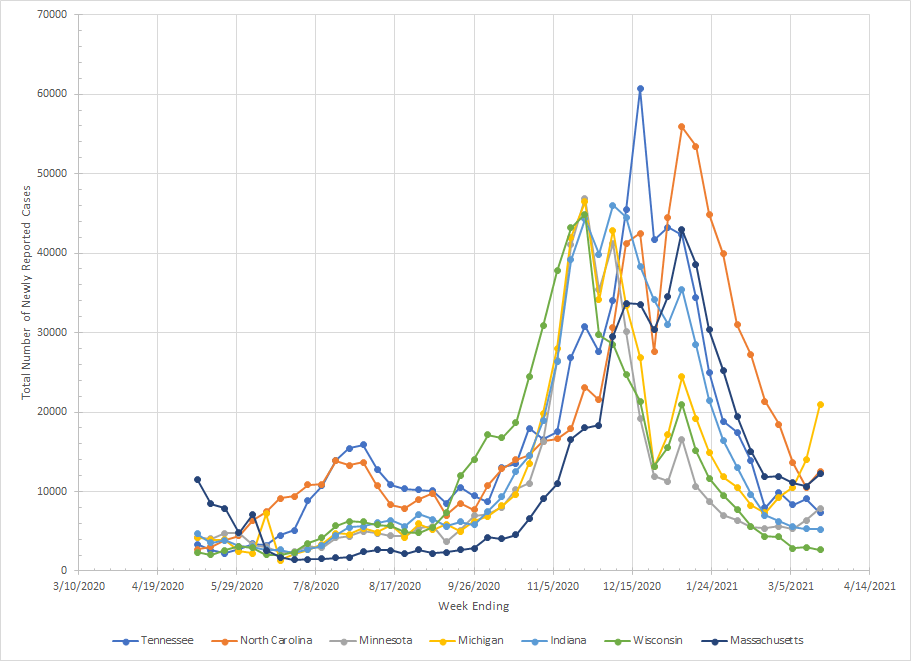
Michigan continues to be a problem. Last week, there were 20,982 newly reported cases which is up from 14,016 the week before and the fourth week in a row with an increase. The fact that we’ve jumped from 10,522 to 14,016 to 20,982 is troubling. I can’t get good hospitalization data from the state website but I can look at ER trends on the CDC website and they are seeing an increase in the percentage of ER visits related to COVID. The 20,982 figure for last week is the highest since the week of January 9th. At peak, Michigan had 46,448 cases so we aren’t yet back to those levels and the rate of increase still isn’t looking like a exponential wave. Right now, there is no sign of a spread to states that border Michigan so maybe it will stay contained. For now, we just have to keep watching.
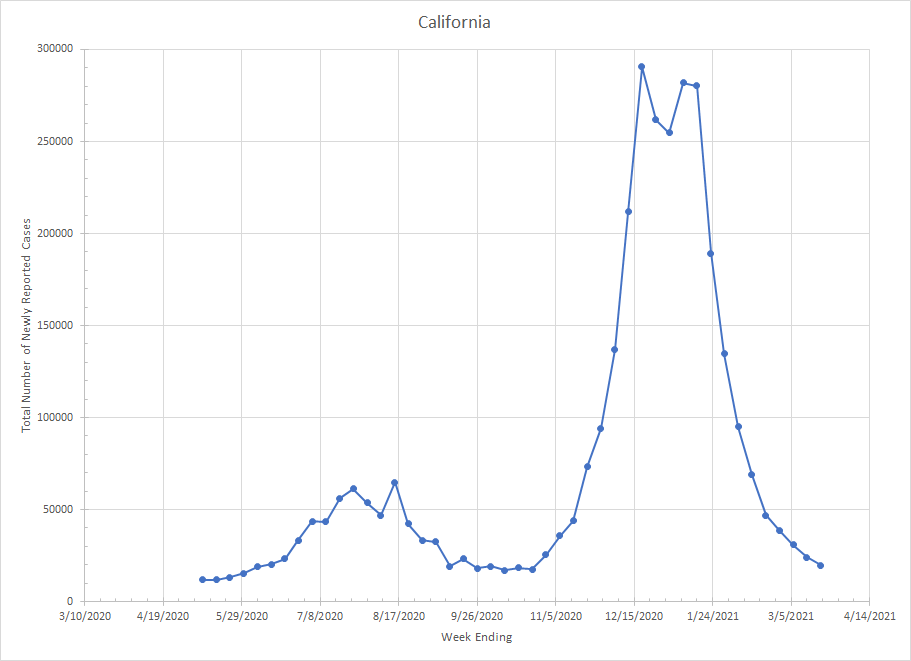
Lets go over the other states. Start with California and Texas which get their own graphs. Both continued to see cases decline and both are just about back to the pre spike levels. As they approach those levels, the rate of decrease is slowing but this is not really a shock. Trends going in the right direction in both states.

In this group, cases went up in Illinois, New York and Pennsylvania and down in Florida, Ohio, Arizona and Georgia. Ohio and Georgia were essentially flat. Of the three with increases, Pennsylvania is the one that we need to watch but it is hard to draw real inferences based on a singe week. Still the number of cases last week was the highest since mid February. Illinois and New York look to be bouncing around a low although it is interesting that cases in New York are still only about 50% of peak where other states are much lower.

In this next group, we’ve already covered Michigan but there were also increases in Massachusetts, Minnesota and North Carolina. Indiana, Tennessee and Wisconsin saw decreases. Michigan quite clearly stands out on the graph. Minnesota did see the largest number of cases since the week of January 23rd and has had cases go up for three weeks in a row. Still, the changes are small and the rate of increase isn’t alarming. Another state to watch for the next couple of weeks. Massachusetts had the highest number of newly reported cases since mid February but it really looks like just some bouncing along a minimum. And North Carolina is just based on a single week so there are no trends yet.
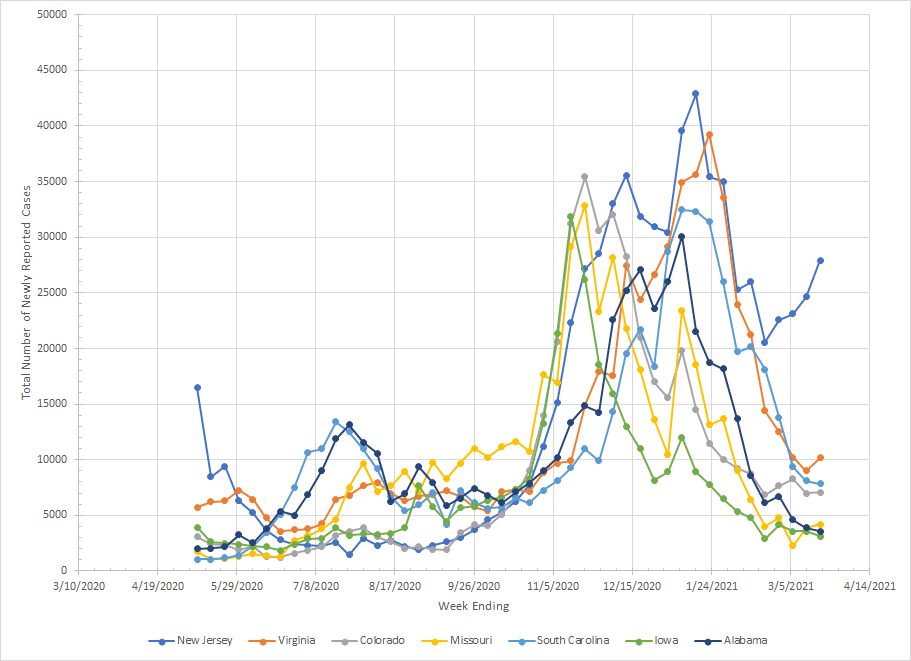
There were four states in this group that saw an increase in cases – Colorado, Missouri, New Jersey and Virginia. Of those, New Jersey is the only one worth noting. Colorado went from 6991 to 7075 and the line is still flat. Missouri had a slightly bigger increase (3898 to 4187) but their curve is also flat and close to summer levels so no concern. Virginia may also be approaching a minimum as the numbers for the last three weeks have been 10223, 9025 and 10183. In New Jersey, cases have increased four weeks in a row and the numbers for last week took a bigger jump and are now higher than any week since the last week in January. Like New York, cases in New Jersey have also not dropped as far past the peak as other states. A little behind Michigan in concern but I’d say it ranks second in terms of places to be concerned about.
Maryland and Washington are the only states showing an increase in this next group and neither is particularly alarming at this point. Maryland had four weeks in a row under 6000 and then had 6435 last week so it is a bigger jump so it is worth watching. In Washington, this was the first increase in many weeks but the last four weeks have seen 5924, 4829, 4357 and 5254 cases so this looks more like bouncing around a minimum than an upward trend.

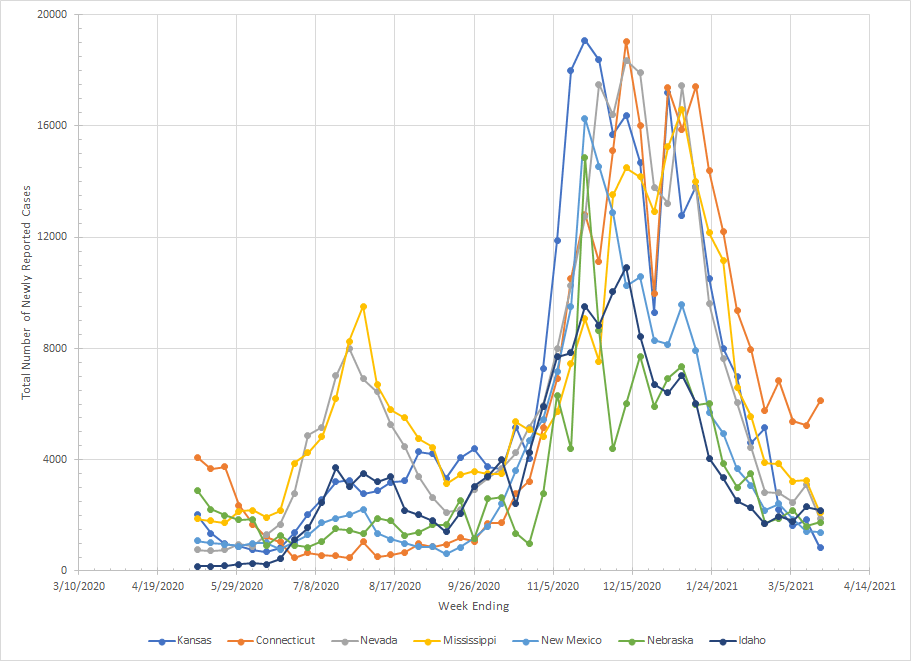
Connecticut and Nebraska are the only two states in this group that saw an increase in cases and neither one is really concerning. Connecticut did have the highest total in three weeks but the general trend continues to be downward. Interesting that like New York and New Jersey, they seem to be flattening way above the pre-peak lows although they are down more than either New York or New Jersey. Over the last five weeks, the numbers in Nebraska have been 1713, 1899, 2178, 1614 and 1750, So, even though they are up from the previous week, the trend is still flat.
Only Rhode Island and Oregon saw decrease. The other five saw increases but none appear to be alarming. I’ll cover them from the largest percentage change to the smallest.
- Montana – after several weeks of declines cases increased from 884 to 1240 but, over the last five weeks, the totals have been 1344, 1196, 1005, 884 and 1240 so they haven’t broken above what looks like the flat area of the curve.
- West Virginia – Over the last five weeks, the number of cases has been 2082, 2216, 1710, 1859 and 2329 so last week does represent a new recent high but not yet above what I would consider the flat area of the curve. No clear evidence of a trend yet.
- New Hampshire – Over the last four weeks, the number of cases here has been 2005, 1529, 1624 and 1997 so we did see a bit of a bump last week. It is harder to see the flattening here but since we didn’t get above 2000, it doesn’t yet look like an alarming trend.
- North Dakota – The last seven weeks here are 544, 474, 677, 552, 577, 585 and 660. This is what a minimum looks like. No trend – just a flat line with some random bouncing.
- South Dakota – Over the last eight weeks, the number of cases are 1107, 1062, 1073, 960, 1128, 1085, 1115 and 1230. Yes, it is true that last week is the highest since the end of January but it still doesn’t come close to breaking out of the flat part of the line.

Hawaii, Maine, Vermont and Wyoming saw cases go up. They went down in Alaska, Delaware and DC.
- Over the last six weeks in Hawaii, the number of newly reported cases were 417, 297, 396, 335, 370 and 486. Again, last week was higher than recent weeks but doesn’t really yet break out of the flat part of the curve.
- Maine is similar to Hawaii in terms of setting a new local high. The numbers for the last six weeks are 1355, 948, 1125, 1143, 1221 and 1436. The percentage change in Hawaii was larger but cases have gone up four weeks in a row which starts to be a trend. I should have been keeping track but if I were going to have tiers of concern, they’d probably be with Minnesota and a few others but still far behind Michigan and New Jersey.
- Vermont continues to be an oddball and it really doesn’t show a sharp decline from the peak like other states. Over the last six weeks, the number of cases was 795, 798, 739, 866, 734 and 857 so it is an up/down pattern which isn’t an increasing or decreasing trend. Cases look to be flat.
- Wyoming – it barely shows up on the graph as the last three weeks have seen 414, 399 and 418 cases. All are below previous week since the start of the wave back in September. Not a concern at all.

So while we did have 21 states see an increase in cases, there are only two that look to be concerns – New Jersey and Michigan. There are a couple of others that need to be watched to see if they break out. Everywhere else cases are either flat or still declining. But we still don’t have any places that are seeing the type of growth rate we saw as the wave started to take off. To me, the news is still almost all good.
