

Has it really just been about a year since the pandemic hit here? It feels like a lot longer. I do remember that this time last year, we ended up skipping a flower and patio show that we’ve gone to every year. I think it might have ended up being cancelled anyway and, of course, they did not hold it this year either.
So where do things stand with respect to cases a year into this thing? Mostly good news as cases continue to drop and/or hit a bottom in most states. A few anomalies we can mention where cases are ticking back up but are not really showing any sort of exponential growth. Just things to watch.
I’ve got a new data source, so the numbers may not exactly match but for the week ending yesterday, there were 11 million tests recorded which is up from the last three weeks but may represent continued clearing of older data. There were 364,440 positive tests recorded which is down from last week. For the week, 3.5% of the results were positive and that is a new low but I take it with some skepticism given the change in the data source. Newly recorded deaths have also been dropping off. Based on the CDC website, which tracks actual death dates, it looks like deaths likely peaked the week ending January 15th although we probably didn’t see a noticeable drop until the end of January.
On to the graphs. This show the total number of newly reported cases by week. I’ve got graphs with states grouped into roughly equal bins based on the peak number of cases. California and Texas get solo graphs because it would be hard to see any other state graphed against them.
For California, cases have continue to decline although the rate has slowed as we reach kind of an equilibrium level that they had back in September and October. I’ll keep stating this but the graphs are never going to get to zero because the tests will always yield some number of false positives.

Next is Texas. We had an artificial low in late February when Texas was covered in ice and there were lots of people without water and electricity. So we saw a mini spike but cases have been dropping since then and are headed towards the lows back in August and September.

In this first group of seven, Pennsylvania is the only state that saw an increase in reported cases. They had 17352 the week before and 17413 this week so it is basically flat. New York continues to fall at a slower rate than most but it did drop last week to the lowest number since the last week in November. Don’t really see any major issues with this group.

In this next group, Michigan continues to be different with cases continuing to rise. One thing I’ve done is to predict the expected total a week out based on the ten day moving average of cases. When we see exponential growth, these predictions are consistently low and the predictions for Michigan were the farthest off on the low side. The actual error was about 0.5% and anything within 1% is really not a big error so cases are going up but not at an alarming rate. Minnesota and Wisconsin were also up from last week but both states are in an area where they should still be considered flat. The rest of the states are fine with cases still dropping. We’ll keep watching Michigan to see if cases take off.

In this next group, we saw increases in New Jersey, Missouri and Iowa. Iowa isn’t a concern since they had 3562 cases two weeks ago and 3563 last week. And Missouri bounced off a low total two weeks ago but both of them are still way off their peak and almost at levels last observed in the summer. New Jersey is the only one with some concern as cases have increased by about 1000 each of the last four weeks. Cases are rising a little faster than in Michigan but they haven’t broken through early February levels so they are another state to watch. Colorado was mentioned last week but saw cases drop which reversed the trend. All the other states are still seeing cases drop including Virginia and South Carolina which were among the last to peak earlier this year.

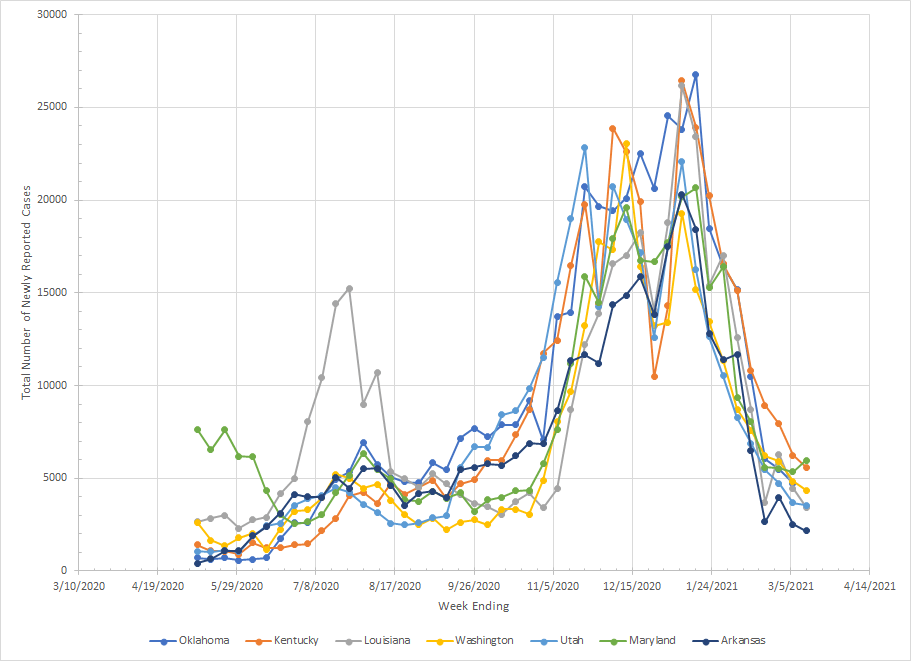
In this next group, the only state to see an increase in cases was Maryland but they’ve been under 6000 cases for four weeks in a row so this looks just some random noise – maybe clearing of older data. The rest of the states here continued to show a decrease in cases with almost all of them back to late August levels.
In this next group, increases were observed in Idaho, Nevada, Mississippi and Kansas. Mississippi is like Iowa as the increase was from 3230 to 3256 or nothing really outside of normal variation. The increase in Kansas was from 1635 to 1840 and the 1840 is still lower than any other week since the end of June so nothing to be concerned about there. Idaho crossed back over 2000 cases but did not break back above the first week in February totals and this is just a single week up so it is more likely some random fluctuations and not a concern. Nevada is similar with over 3000 cases last week which was the highest since mid February when they had around 4400 cases. The 3000 cases is similar to where they were at the low in September so it also doesn’t look like a problem.

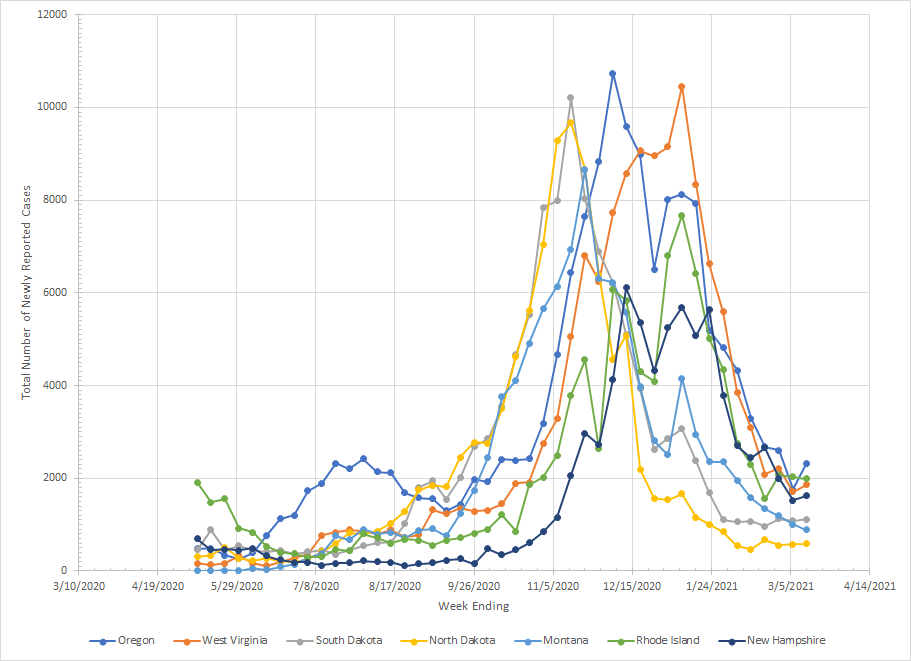
Five of the seven states in this next group saw an increase in cases: New Hampshire, Oregon, West Virginia, South Dakota and North Dakota. North Dakota went from 577 to 585 and numbers in the 500s are mid July levels so we are just seeing a flat line with some random bouncing. Same story for South Carolina which went from 1085 to 1115 but has been doing ups and downs since the last week of January. West Virginia went from 1710 to 1859 but the 1859 is still lower than any week since mid October so no reason for concern. Oregon went from 1764 to 2313 but the 2313 is lower than any other week since early October so, again, we aren’t seeing a major increase that would be a concern. And New Hampshire went from 1529 to 1624 and the 1624 is still lower than any other week since November 7th. All of these states are near lows and these increases are not yet alarming.
In this last group, we again had five states with an increase: DC (not really a state but I just consider it one here), Delaware, Maine, Hawaii and Alaska. Alaska went from 897 to 898 and has been below 1000 every week but one since early February so this is clearly not a concern. Hawaii went from 335 to 370 and has also been moving up or down for five weeks in a row so we don’t have a consistent pattern or a concern. Maine has had increases for three weeks in a row and had 1221 cases last week. That is still under the 1355 during mid February so we aren’t seeing a significant rate of increase but we need to watch the trend. Over the last three weeks, Delaware has had 1986, 1622 and 2017 cases and the 1622 looks like it might have been low and maybe there was some catch up last week. They still haven’t approached levels from mid February so it doesn’t look like a continuous increase. DC is one to watch. Over the last five weeks, the case numbers were 919, 757, 925, 795 and 1159 so we’ve hit the highest total in over a month but it is hard to make accurate conclusions about a single point so we have to wait for more data.

While there are a few places to keep an eye on, we don’t have any state where we are seeing the type of exponential growth we saw back in the fall and winter. There are several states that are back to summer and early fall levels before this third wave really took over and they really don’t have increasing or decreasing trends but are just flat with some random bouncing. As of yet, there is no real sign of anything taking off again and more than half the states are still seeing cases declining. Heading into spring, things look pretty good.
