I say that for two reasons. First, we are moving out of winter. Second, the COVID numbers continue to drop. If they were to rebound at this point, it would be more like a Dark Spring than a Dark Winter.
I’m not going to show my usual set of graphs because most of them just continued the downward trend and they aren’t providing a lot of new information.
Here is the overall summary for the week ending on March 6th. For the week, there were 10.1 million tests recorded. That is down slightly from last week but is still very high given that, for the week, there were only 417,419 positive results recorded. This is back to Mid-October levels which is about when the sharp spike started in a lot of places. The difference is that fewer tests were run back then so, for last week, the percentage of positive results was 4.2%.
I’ve mentioned this before, but it needs to be repeated. The lowest figure I’ve got from this data source for any week was 4.1% back during the week that ended on October 3rd. The 4.2% is down from last week and represents the eighth week in a row where the percentage of positive results has declined.
And I have to keep mentioning this but we will never see the number drop to 0 because the tests aren’t perfect. We will eventually hit a floor where the bulk (if not all) of the “positives” will simply be false positives. We have a few states that are already there. Maybe there is an argument to be made to continue the high level of testing for a few more weeks to confirm that we’ve hit a bottom but, at some point, if the numbers don’t start rising again, we have to move towards a saner testing regime. If the prevalence is low, then there is no good rationale for continuing to test almost as many as we were doing at the height of the pandemic.
If you look at the total number of cases week over week, there were seven states that showed an increase and all the rest showed a decrease. A big improvement from last week when things were split almost 50/50 and because we’ve recovered from the disruption caused by the ice and snow back in mid February.
The seven states are Vermont, Alaska, Michigan, Colorado, North Dakota, New Jersey and Maine. I’ll go ahead and show you graphs but the only two where there might be some concern are Colorado and Michigan.
I’ll start with Colorado. The blue points are daily case counts and the orange is a ten day moving average. It gets messy at the end but you can see the orange points starting to move back up. Now, it has just moved back to mid February levels so it is still well below the peak and the weekly totals have only gone up two weeks in a row so it is hardly a trend. Still when everything else is going down, the places that aren’t stand out and need to be watched.

Here’s the graph for Michigan which ends up looking a lot like Colorado. With this data source, I had a lot of days with 0 cases in the fall when I was primarily using the other data source. Now that I have to use this data source, I’ve been more diligent about filling in the zeros. The total for Michigan last week was 10522 which is the highest since the first week in February. But, again, we’ve only seen cases rising for two weeks in a row so it is not enough to say there is a trend. It is possible we saw more depression of the numbers here and in Colorado back in mid February due to the weather and we are just seeing an extended clearing of the backlog. But, like I said for Colorado, in an environment where everything is falling, places with cases going up stand out and need to be followed.

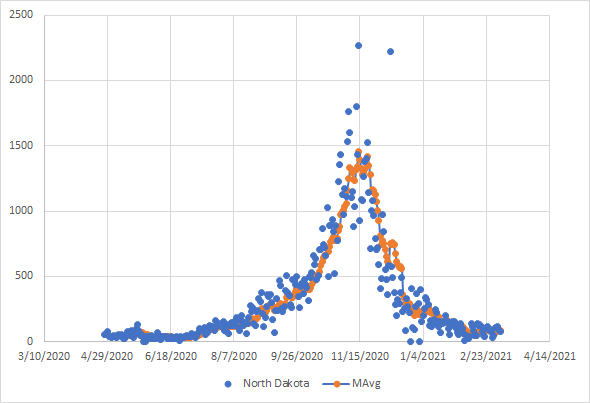
The next two graphs are for Alaska and North Dakota. Both have reached a floor and are just bouncing around that most likely based on testing volume. From January 30th, Alaska has had the following weekly totals: 1025, 809, 1003, 916, 791, 897. So yes, last week was up but there is no trend. For North Dakota over the same span, the totals are 842, 544, 474, 677, 552, 577. Again, last week was up from the week before but there is no real trend in the results.

One note on Alaska – they stopped reporting numbers on the weekend in February so the numbers for Monday are often higher than the rest of the week. That’s why you see the zeros and the high points in February and March. The average helps smooth that out.
Both Maine and New Jersey saw cases go up by about 2% last week. For Maine, that was an increase from 1125 to 1143 and for New Jersey is was from 22593 to 23123. In both states, these numbers are still lower than the week ending February 13th and a 2% increase is hardly a sign of a new leg up in cases. Both are still falling from peak values in mid January and this is most likely just a data artifact and they’ll both drop next week.


The last state on this list is Vermont and I’ve mentioned before that they are an outlier in the country. Going back to the week ending on January 23rd, the weekly totals for Vermont have been 993, 923, 935, 796, 798, 739 and 866. What I don’t show here is that Vermont has been below 2% positives since mid February but, for some reason, they kicked up testing. Over six of the last seven days last week, they recorded over 100000 tests which is the highest number of tests they’ve done. Given the low percentage of positives, the most likely conclusion is that the increase last week is an artifact of increased testing. Why they ramped up testing with such a small percentage of positives is beyond me.

I will probably stick to this type of update as long as case numbers continue to decline because the other graphs aren’t very interesting so we’ll just be focusing on those places where cases are going up.
Have no idea what we need to see to convince people that the risk is low enough to go back to living. Hope we don’t have a lot of people waiting for things to drop to 0 because we aren’t going to see that unless we sharply reduce testing and get to a place where we are using a test to confirm probable cases. Cast a net too wide and you’ll catch a whole bunch of stuff you don’t want.