

Because I spent many of my work years dealing with numbers, I’ve always been interested in data and patterns. And, since I’m not working and with the world being shut down for a bit, I was doing some analysis with data on the WHO site. Africa presents some challenges as there are many countries that don’t report regularly so you’ll go for days with 0 new cases and then they’ll be a big drop of data. But I had noticed cases spiking in a few places lately and so I took a deeper look.
So I divided it up into six groups of countries based mostly on latitude but also trying to account for the different climatic zones. No grouping is perfect because there are always going to be places that straddle borders or have other differences from the countries around them. And I included the island countries or territories which might not be all that similar with places at the same latitude.
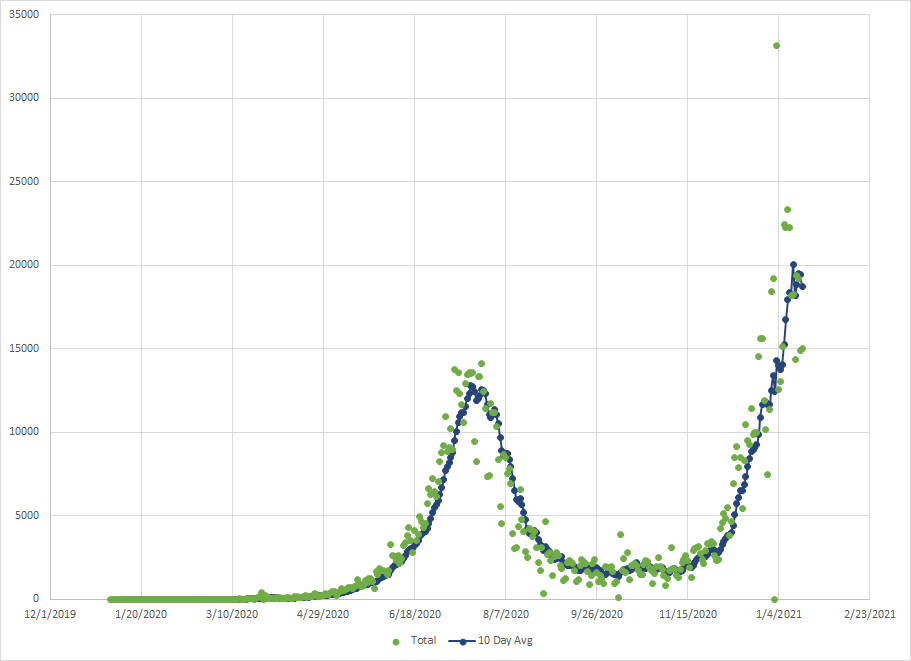
What I’ve plotted is the total number of cases for the countries in a sub group along with a 10 day moving average.
This first group is the five countries that border the Mediterranean from Morocco to Egypt. I won’t show you the graphs but this pattern is similar to a couple of places on the other side of the Med like Italy and Greece. Of course it is also like the patterns in some of the northern states in the US which aren’t anywhere near the Med. But we have a first wave that stalled in early July and then kicked off again in August, rising to a peak in Mid November. Things have dropped since then but appear to have hit a plateau. There is a lot more variability around the line now then there was earlier in the year so the pattern probably bounces around from country to country.

The next group is mostly between 10 and 20 degrees north. Many of these places have a significant amount of land in the Sahara desert so this is not tropical Africa. I probably should have put Gambia and Guinea Bissau in the next group because they are more tropical but the number of cases there is small and wouldn’t change the graphs significantly. The high points are from Mauritania which is one of those places that dumps a bunch of cases periodically. If I wanted to be fancy, I probably could have tried to even those out by just averaging over the days. Here, we also get a wave in the spring but it stopped in early June and then the number of cases started dropping hitting a low in early November. They’ve gone back up since then but the second wave was shorter as it appears to have mostly stopped by the end of December and now things are basically flat. Although it is fair to point out that there is a lot of variability here at the end so we shouldn’t be too confident in the trend line.

The next group is mostly tropical and contains those countries that are mostly north of the Equator. Ethiopia has a lot of different climate zones and Somalia is desert so they don’t really fit climatically with the rest of the group. Could have move Somalia into the group above or kept the two out since they are kind of outliers. But there are a lot of places in this group so I don’t think the patterns would have changed significantly. The shape of the curve has some similarities with the last region but is clearly not the same. The first wave was longer with the peak not being hit until early August. The drop was a little steeper but shorter and the second wave started in early October. The rise for the second wave hasn’t been as steep and has not yet passed the peak of the first wave. This makes this region different from the first group where the highest peak was during the second wave and in mid November. All three of the regions above the equator seem to have plateaued with cases no longer rising but not falling either.

The next group are mostly tropical and just south of the Equator. Like everywhere else, we get a first wave early in the year which peaked around the end of June. While cases started to decline, they really didn’t drop significantly until we got to the end of September with a minimum in the middle of October. What we’ve seen recently is an almost exponential rise so this second wave has passed the peak of the first and looks to be still be going.
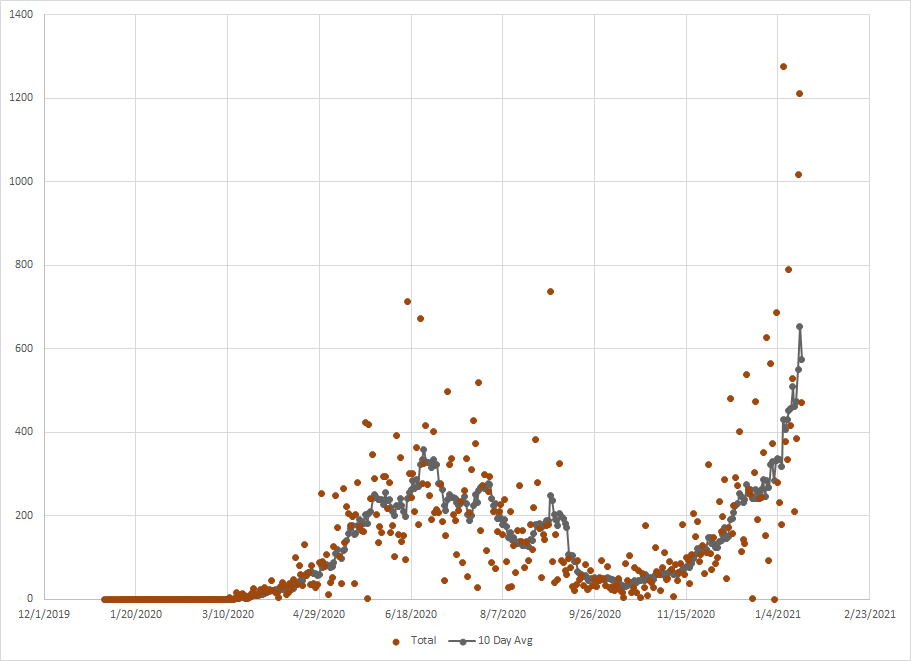
This next group was mostly humid sub tropical and all south of the equator but generally north of 20 South. I was able to check a few of these places and the rainy season typically starts sometime in December in these places. The two countries I noticed were Zambia and Zimbabwe but there have also been jumps in Malawi and Mozambique. Interesting that this region wasn’t really touched that much early in the year. There was a slow rise until early July when we had a small wave that ended in early August. And then a slow decline until the start of the year when the rise has turned exponential. And much more extreme than what we saw in the last group. Past history says these rises could go for 4 to 6 weeks so if any region is a concern, it would be this one.

The last group is dominated by South Africa but also includes Namibia and Botswana. We have two waves. The first was during their winter with a peak in mid July. The second wave started in Mid November and may have peaked although it is too early to know. I guess South Africa also has a variant of the virus so who knows what that means to all of this. The second wave did hit a higher peak than the first but some of that is coming from the other countries in the region. The daily cases in South Africa weren’t that much higher than July so I don’t know how much, if any, difference this variant made.
So, yes, this is what I do with my spare time. If I had easy access to more data, I might try to tie this to other things like maybe the rainy season. But that’s a little more than I could probably easily do and there could be a whole host of reasons to explain what is going on. The only thing I do keep seeing is that the data follows patterns and there is some seasonality. If something follows a pattern, then typically it can be explained. I’ll leave that for smarter people to try and figure out.
Going to do a deeper look at the US in the next couple of days but I spent some time doing this and you are my only audience. (Maybe I should work up a PowerPoint for the next family call).
