

The short answer is yes in some places, no in others. As we are now one week into the new year, we are closer to getting back to “normal” when it comes to data and reporting. And what we can see is that the disruption due to the end of the year was a little bigger than I thought. In terms of raw numbers, many of the states are now back to pre-Christmas levels. It will likely take another week to sort out how much of the increase we are seeing now is just clearing the end of the year backlog and how much of it represents a continued increase.
The website where I get the majority of my data changed their front page to look at hospitalizations. The current headline is that “record hospitalizations point to trouble in California and the South”. This is another case where the headline is factually true but maybe doesn’t provide all the context. It is my understanding that one of the treatments for Covid (Remdesivir) requires hospitalization to monitor liver function. I have no information on how widely it is being used or what percentage of those in hospital are currently under that treatment. It would be nice to know though.
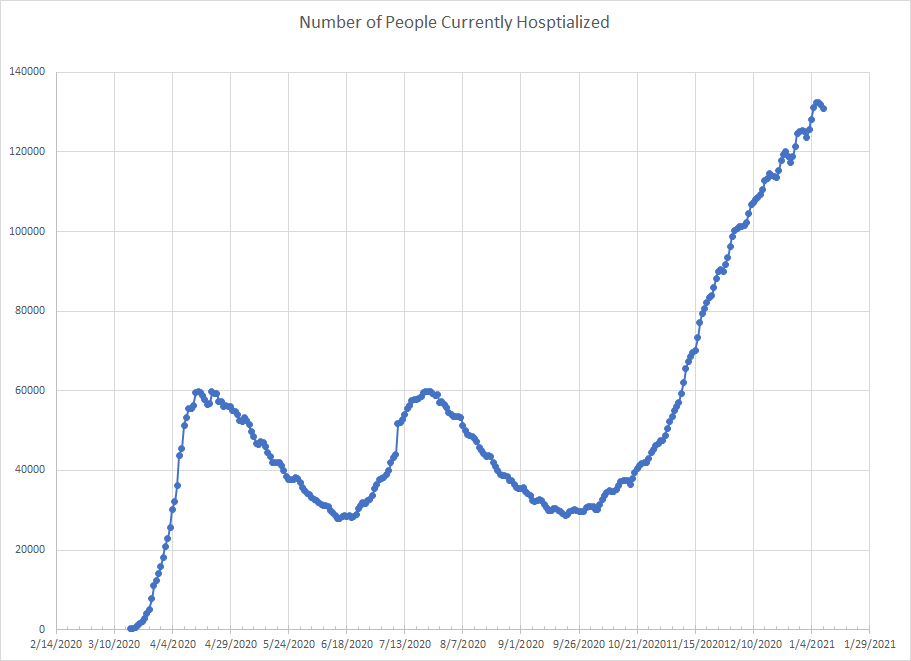
But let’s look at a couple of graphs. The first shows the number of people currently hospitalized who have tested positive for COVID. Yep, we are clearly at record levels. Part of that is because the first wave was primarily the NYC metro area and Massachusetts and the second was the Sun Belt. This third one has kind of rolled across the country. Hard to see in the graph, but there are a couple of inflection points where the rate of change slows but it has clearly continued to rise.
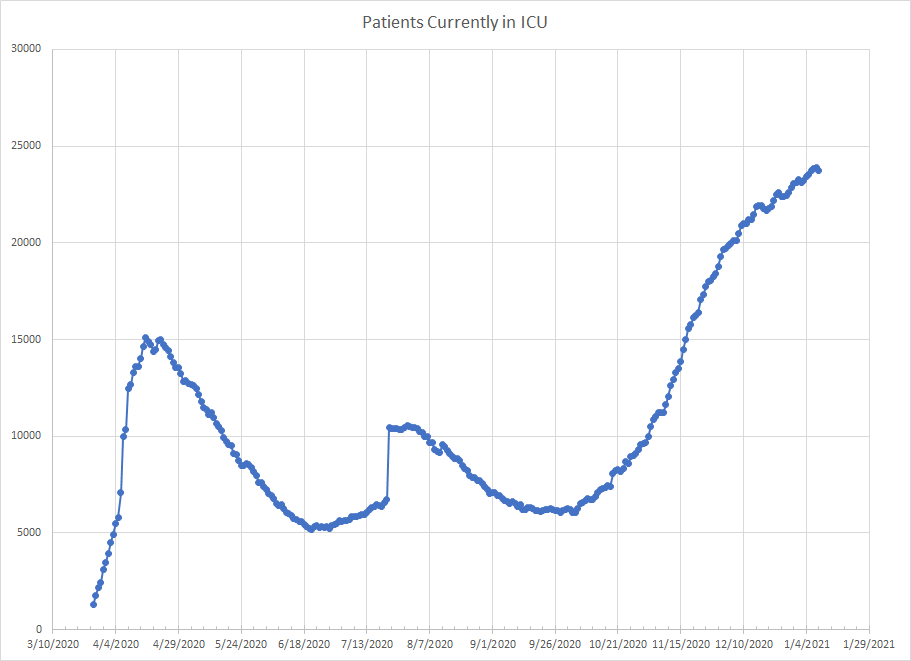
We get a similar story with the graph of people currently in an ICU who have tested positive for COVID. The change in the slope is more obvious here but it still continues to go up. Like I said before, this particular wave is rolling across the country so it is a new group of states now then it was back in October/November when things started. As I’ll get to, there isn’t yet strong evidence suggesting another upward trend in those places that were hard hit in that time period which might help to explain why the rate of change is slowed.
Another thing we haven’t checked in on a bit is the overall summary of tests and positive results. For the week that ran from December 27th to January 2nd, there were 10.8 million tests reported. That was the lowest total since the week of November 8th. Without better data, we don’t know if that was actually fewer tests run or just that the various labs didn’t report that week. For this first week in January, the number jumped back to 12.3 million which means we haven’t yet topped the 13.3 million during the week of December 13th which could have just been inflated due to people wanting to get tested before traveling for the holidays.
For the last two weeks, the percentage of positive results has been over 13% which is the highest since back in April. In this first week in January, there were 1.7 million reported positive results which is the highest ever. (Remember that testing is more than 10X what is was in April and that influences the results). And, because we saw a dip in reported positives during the two holiday weeks, we don’t know how many of these are new cases. And I don’t know if the various labs have been focusing on getting the positive counts out first meaning that we might get a big dump of negative results later. It could also be that for the last two weeks, the number of asymptomatic people getting tested has dropped so the 13% is more indicative of the “real” rate. We really aren’t going to be able to understand this until we get another couple of weeks of data.
If I look at cases (with the appropriate caveats) and my ten day moving averages, there are 15 states that are currently at an all time high. Those are Maine, Vermont, Arizona, West Virginia, Massachusetts, South Carolina, New York, North Carolina, Virginia, Kentucky, Oklahoma, Georgia, Florida, Mississippi and Maryland.
That list is also sort of in order of growth from fastest to slowest. I would probably put the first nine in one bucket and the last six in another. That’s a little arbitrary but it does group places with faster case growth.
A few others that rank high in case growth are New Jersey, California, New Hampshire and Rhode Island. New Jersey just dumped a bunch of probable cases so we need time to sort that out. Rhode Island had lots of gaps in data reporting so that’s another places where we need time to see what is real. California may actually be at peak so I might rank them just below the first nine. Again, we need more data.
To continue with some arbitrary rankings, states that are still close to a record high with moderate growth (relative to the rest of the country) would include Alabama, Arkansas, DC, Louisiana, Utah, Delaware, Texas, Connecticut, Nevada, Washington and Pennsylvania. Utah is interesting since it seemed to have peaked earlier in December. Now that may not be true. Pennsylvania is another places that needs to be watched – it looks more and more like it is past peak but things have not yet started to show a real decline.
That leaves 21 states where the worst of the fall/winter increase in cases appears to be over. None of these places has seen a significant bounce back as the new year has started although we need to see more data for the first few. Those are Tennessee, Hawaii, Oregon, Ohio, New Mexico, Indiana, Missouri, Colorado, Kansas, Nebraska, Iowa, Illinois, Idaho, Michigan, Minnesota, Alaska, Wisconsin, Wyoming, Montana, South Dakota and North Dakota.
Before I end, I wanted to touch on one other subject. I suspect there is a significant amount of virus fatigue out there. I mean we’ve been dealing with this for almost a year now and there are all these nasty stories about the mutant variant that might just start another cycle. And, from what I see on social media, there is a subset of people who think we should have been able to have brought this under control by now.
I don’t know if their perspective is limited to the US or if they are talking about the world. And I’m not a mind reader but it seems like the thought is that we are smart humans and we should be able to deal with a virus which is such a lower life form. That thought process kind of assumes we are above nature and not part of it. I know it may be frustrating to think that human progress can be stalled by a simple virus but maybe it is a reminder that we just aren’t in as much control as we think we are. Nature still has things we don’t understand and can’t control.
And the more I see from various places, the more it seems clear to me that the only real way to have “control” over this is to be on an island and isolate yourself from the rest of the world. Otherwise, this is just a highly contagious thing that doesn’t need much to take hold and start causing problems.
Just to give you an example, I’ve got a graph showing reported new cases per day in Thailand. This is from the WHO and I’ll freely admit I haven’t tried to search for any explanation so I have no idea what is going on beyond the number that are reported here. But you can see that Thailand has some cases back when all this start and then went many months with nothing and suddenly saw a big increase at the end of the year. Now, they still rank very low in terms of cases per population and I don’t know if we’ll continue to see an increase. Still, it is just odd that they could go for months without any cases and suddenly have things explode. Think it just shows how difficult it is to truly contain this thing.

I don’t know where the light at the end of this tunnel is but I just have to believe there is light. We’ve certainly had other pandemics and plagues and they’ve all eventually ended. This one will too. But it seems to operate on its own schedule. Our power to control things is limited and maybe that is the message we should be taking from all of this.
