


I don’t know that I’ll be able to do any real updates on the virus numbers until we get through the next two weeks because I expect serious disruptions due to Christmas and New Year’s Day. We’ll see how things go. Would recommend not paying much attention to the news just because there could be some anomalies in the daily totals. Actually, you are better off not paying attention at any time just because the news seems to do nothing but stoke fear to keep you tuned in.
There is a great deal of evidence suggesting that this current wave is starting to slow. There are exceptions (California) but a lot of places are just in the beginning of a potential downturn so it may not be clear from the daily numbers. I’m choosing to look at things perhaps a bit rosier than they are. They are bits of data that don’t yet align – we haven’t yet seen a true drop in hospital or ICU population which would help to confirm that we are starting down the hill.
And it is certainly possible that things could pick up again. I’m not an epidemiologist but I’ve read enough to believe there is seasonality to respiratory illnesses. And we still have a lot of winter to work through. We are just starting into the coldest period of the year as well and that could play a part. We do have vaccinations going on and there is the concept of herd immunity which might make future waves smaller.
I’m basing this off my rolling two week sums of cases and the total percentage of positive results over that two week period. As I’ve said before, both measures have issues. Cases are going to be dependent on tests. And states are inconsistent with their reporting of negative results so the percentages can fluctuate more than they should.
One thing I’ve added to the spreadsheet is to look at the percentage change in cases between two week periods. For example, with the most recent data, I’m comparing December 9-22 to the period from November 25th to December 8th.
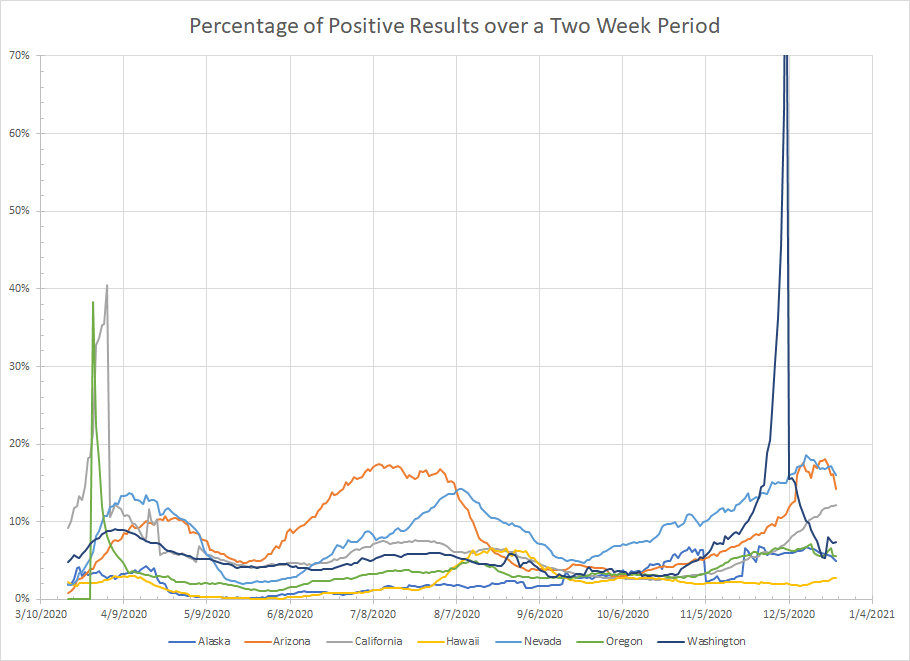
Enough talk, show me some pictures. As a reminder, this is the percentage of results that were positive over a two week period. And I’ve roughly grouped the states by geographic regions – east to west and north to south.
- Connecticut – they don’t report on weekends so Monday has typically been the highest day of the week. The numbers for the 21st were the lowest since November 9th and the two week totals have started to drop. At this point, Connecticut looks to be on the way down.
- Massachusetts – very similar to Connecticut as the two week sum of cases seems to have peaked on December 16th. Percentage of positive results has been more flat but it does seem like cases are dropping.
- Maine – Still on the way up as the data from yesterday was a high for the sum of cases and percentage of positive results. But, when I look at change, the rate of increase has slowed in the last couple of days. Increasing but not as fast.
- New Hampshire – A bit like Maine but both cases and percentage of positive results have been lower for the last two days. Because I’m being optimistic and because I think these patterns are predictable, I’m going to say cases are dropping here as well.
- New Jersey – Like many of the states in this region, things appear to have peaked last week. New Jersey is inconsistent in reporting negative results so the graph has all the peaks but the pattern is down. So cases are dropping here.
- New York – Another exception because we reached another new high yesterday. But things are clearly slowing and the percentage of positive results has started to flatten. Not quite ready to say it is flat so it is still increasing but at a much slower rate.
- Pennsylvania – Kind of mixed results as cases are dropping but the percentage of positive results hasn’t yet followed. Still, it does look like cases peaked on December 16th. The number of newly reported cases for the last three days have been the lowest since before Thanksgiving.
- Rhode Island – Both cases and percentage of positive results have been dropping. The sum for the last two weeks was the lowest since before Thanksgiving.
- Vermont – I’m beginning to sound like a broken record but one thing this exercise has done is started to convince me that we see the same patterns in these regions. The numbers for Vermont peaked last week and have started to come down.

Next region with a similar story. We had a couple of states where things had been climbing but that is no longer the case.
- Delaware – New region but same story – cases look to have peaked last week. Percentage of positive results has been flatter but down from the peak last week. Rate of change is down suggesting cases are dropping.
- DC – Wash, rinse, repeat. The sum of cases peaked on December 16th and has been dropping since then as well as the percentage of positive results.
- Maryland – Again, the sum of cases was highest last week. They spent about a week at a plateau but things have been dropping since. The percentage of positive results for the last two weeks was 5.8% which is the first time it’s been below 6% since the beginning of December.
- North Carolina – Continues to be kind of an oddball situation. Never really had a true run up like states further south but doesn’t yet seem to be dropping like other places in this region. Cases have been flat for a week and the percentage of positive results has been between 10.5% and 10.7% since December 13th. I’m just going to call them flat for now until we see which way things are going to go.
- Virginia – Actually looks more like North Carolina so maybe they aren’t the oddball I think they are. Cases have been flat since the 17th and the percentage of positive results has been between 11.5% and 11.7% since December 13th. But I do see movement in the rate of change which has started to drop. Things are clearly not increasing but there isn’t enough evidence to say things are decreasing so they are flat as well.

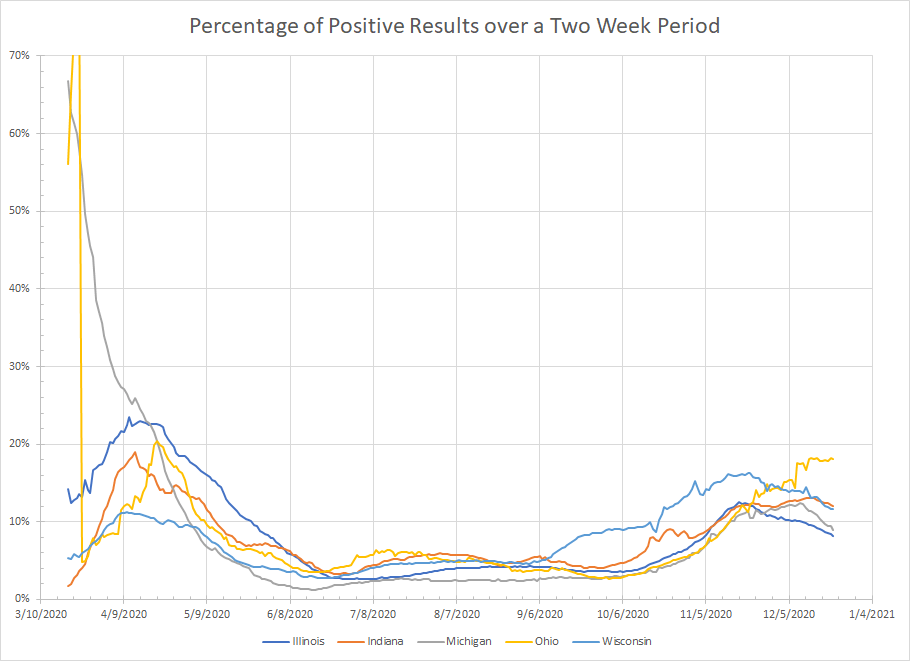
On to the Midwest where things continue to improve.
- Illinois – things continue to drop. The sum of cases is at the lowest point since November 7th. For the last two weeks, the percentage of positive results was 8% which is the lowest for a two week period since November 4th.
- Indiana – There is now evidence that things are on the decline. Indiana was a little later than some of the Midwest with cases not peaking until December 12th. The percentage of positive results for the last two weeks was 11.8% which is the lowest for a two week period since November 15th.
- Michigan – Like Illinois, things continue to decline here. The sum of newly reported cases and the percentage of positive results are at the lowest levels since early November.
- Ohio – Ohio reported over 25000 cases on December 8th. This contained a backlog of older cases and it is like a snake swallowing something because you just have to watch it move down the body until it is gone. That day just dropped out of the two week totals and it resulted in a pretty big drop in the number of cases and the percentage of positive results. Things had been dropping a bit before then so I’m comfortable saying things are declining here as well.
- Wisconsin – We continue to see declines. The percentage of positive results for the last two weeks was 11.4% which is the lowest for a two week period since October 20th.
Moving to the next region. Like North Carolina, we really haven’t seen big exponential rises in any of these places but they have all been trending up recently. A closer look:
- Kentucky – Mixed signals here as cases are dropping but percentage of positives has gone up. Testing is down which kind of explains this because they could be focusing testing on more symptomatic people. Still the total number of cases has been dropping. Despite the percentage of positives, I’ll say things are declining here.
- Tennessee – Things still on the rise here but the rate of change has slowed a bit. Percentage of positive results has flatted and has been between 18% and 18.4% since December 16th. It might be too early but I’ll call it flat for now.
- West Virginia – They are somewhere between flat to slowly increasing. The sum for the last two weeks is a new high but we had a break in the upward trend on the 20th. The rate of change has slowed but not that much. Clearly whatever rise is going on here and in Tennessee doesn’t fit the exponential rise we’ve observed in other places.

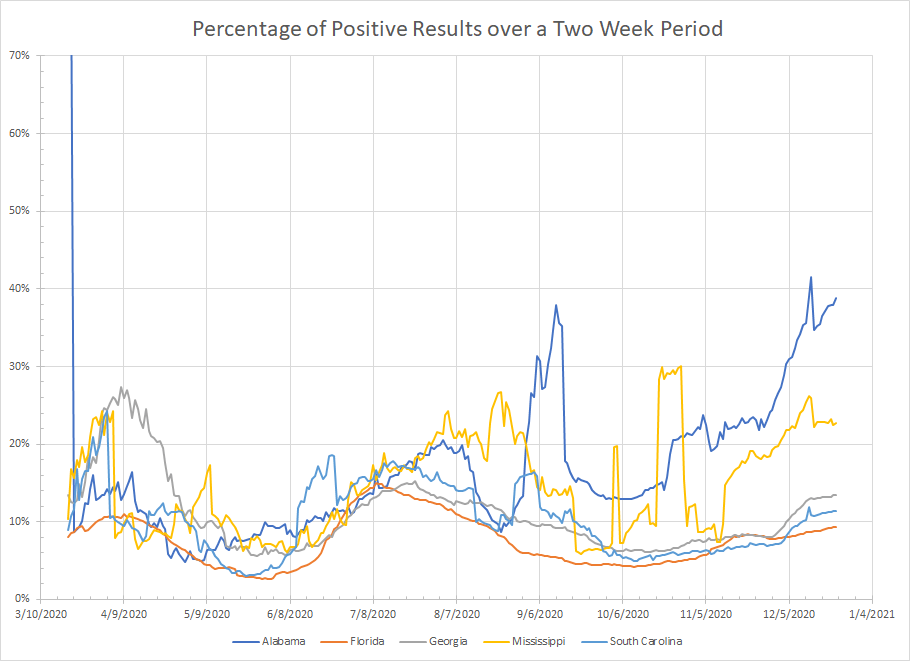
In the south where we have to deal with inconsistent reporting from a few places.
- Alabama – I don’t really trust percentage of positives as much as I would in other places. Cases did hit a new high yesterday so things still appear to be going up but the rate of change has slowed. On December 1, the sum for the previous two weeks was 32052. On the 11th, it was 45901 or an increase of roughly 14000. Yesterday it was 53146 or an increase of roughly 7000. So over equal time periods, we see a smaller increase in the sum of new cases.
- Florida – Things are going up here but it is very hard to see on the graph. The rate of change has been almost constant since the 13th. For the last two weeks, the percentage of positive results was 9.4% which is the highest since August 18th but the rise has really been slow.
- Georgia – Also still increasing here. The percentage of positive results for the last two weeks was 13.5% which is the highest since July 29th. But it hit 13% on December 12 so the increase over the last ten days hasn’t been that great. Some evidence that the rate of change is slowing.
- Mississippi – They dump negative results once a week. If I compare those days for the last three weeks, the percentage of positive results was 22%, 22.2% and 22.4%. We do see cases going up but the rate of change is slowing. If I do the same comparison I did for Alabama, they had a two week total of 18608 on the 1st, 26895 on the 11th and 29765 on the 22nd. So roughly an 8000 increase in the first part of December and a 3000 increase for the second part.
- South Carolina – When you look at the sum of cases, they have been between 41063 and 41307 for the last five days. Kind of means that they are basically seeing the same number of new cases each day so the sum doesn’t change. The rate of change is slowing but I think it is better to just say things are flat here.
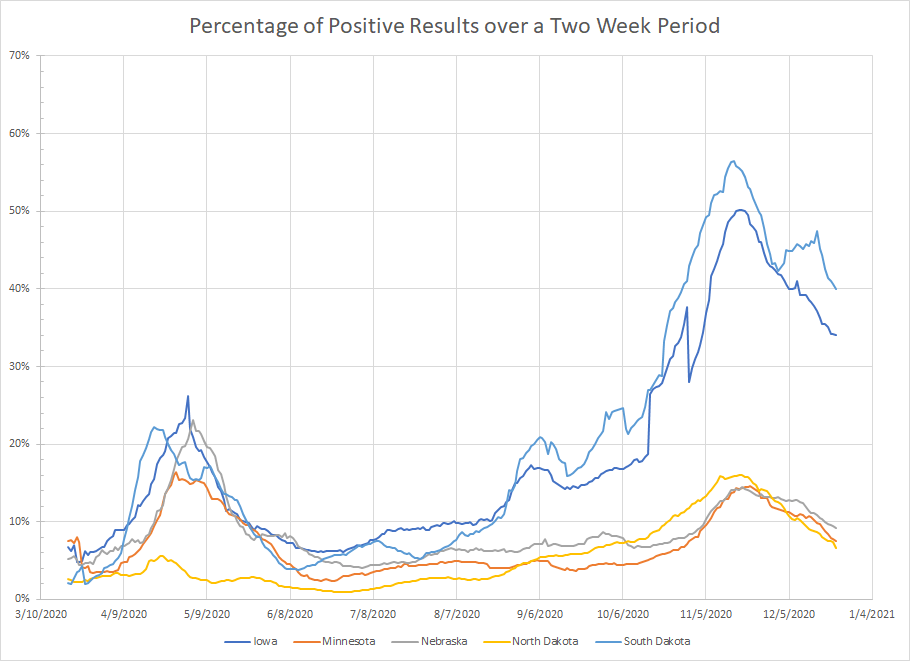
This next one doesn’t require lots of thought – all of the graphs are going down.
- Iowa – Cases continue to decline. The sum for the last two weeks is the lowest since October 30th.
- Minnesota – Also see declines in both cases and percentage of positive results. Also back to late October/early November levels.
- Nebraska – Broken record again as things continue to decline and are at late October/early November levels.
- North Dakota – Kind of dropping like a stone here. For the last two weeks, the percentage of positive results was 6.6% which is the lowest since September 26th. The total number of newly reported cases for the last weeks was 4777 which is the lowest for a two period since September 22nd. At the peak in mid November, they had a total of 19504 cases with 16% positivity.
- South Dakota – Continue to see numbers dropping with things back to mid to late October levels.
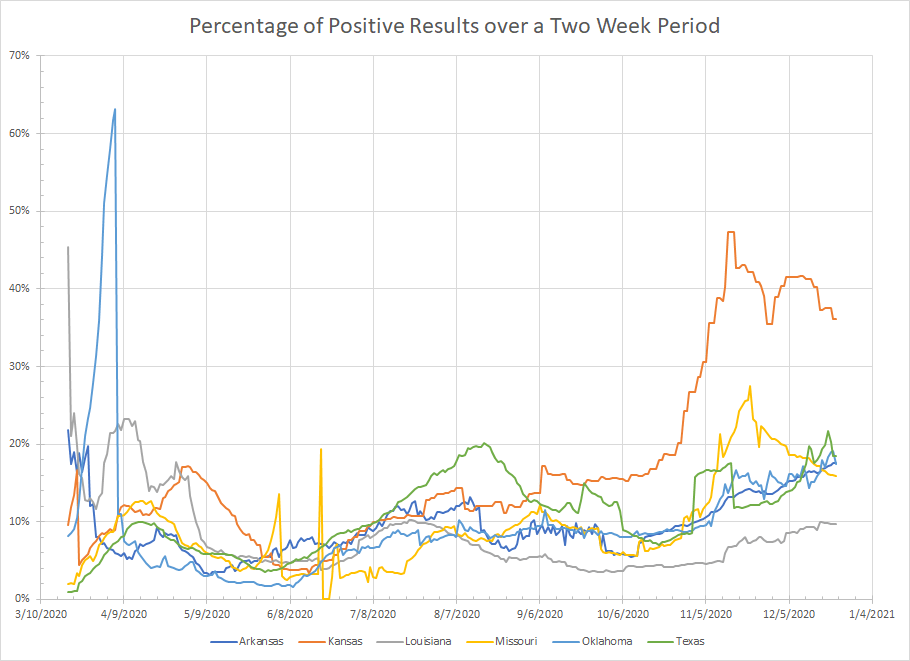
For the most parts, we saw similar performance between states in the various regions shown above. This is one of two where I’ve combined places that don’t really act the same.
- Arkansas – While percentage of positive results has inched up over the last weeks, cases have been fairly consistent since the 17th. Don’t really see any patterns in the period over period change. Percentage positive would say things are slightly increasing but flat is probably a better description.
- Kansas – The most inconsistent state when it comes to reporting making it hard to really see what is going on. Still, three of the last four reports have shown less than 5000 new cases and that is the first time that’s happened since early November. Things do look like they are dropping.
- Louisiana – They’ve been up and down in both cases and percentage of positive results since mid December. No clear trend so they should be considered flat.
- Missouri – Things are definitely on the way down here. The percentage of positive results was 15.9% which is the lowest since November 7th and you get a similar story for total cases. They look to have been in the group of states that peaked in late November.
- Oklahoma – Both cases and percentage of positive results have been slightly higher the last couple of days. The trends aren’t clear but the it looks more like slightly increasing than flat.
- Texas – For the first part of December, things were clearly increasing. Over the last ten days or so, the pattern has been more up and down. I’m going to say flat for now until we see which direction it is going to go.
Now we get another easy region where we continue to see improvement everywhere.
- Colorado – The percentage of positive results for the last two weeks was 8% which is the lowest since November 4th. Total number of cases is the lowest since November 11th. Trends are for further drops.
- Idaho – Another place where I’m not sure what is going on with percent positives. Cases peaked on November 26th and then again on December 11th (maybe one of the few places that saw a Thanksgiving surge??). But they’ve been steadily declining since the 18th so the trend is for continue declines.
- Montana – Declines continue in both cases and percentage of positives which are now back to mid to late October levels.
- New Mexico – A very short surge back in November that looks to be over as cases and percentage of positives are back to pre-surge levels.
- Utah – Kind of like Idaho. There was a peak on November 24th and then a second, smaller one on December 10th but cases just kind of bounced around for a bit. For the last week, the pattern has been down in both cases and percentage of positive results with both back to early November levels.
- Wyoming – With the inconsistent reporting of negative results, it is hard to find a real trend in percentage of positive results. Cases have been consistently dropping since the peak on November 23rd and are back to early November levels.

My second grab bag region where all the states kind of act differently and we also get reporting issues in Oregon and Washington.
- Alaska – Things are clearly dropping here. The percentage of positive results for the last two weeks was 4.9% which is the lowest since mid November. Things had been flat here for two weeks but have really started to drop in the last week.
- Arizona – They had big spikes in cases on the 1st, 8th and 14th but that pattern seems to have broken. Since the 8th just dropped out of the two weeks totals, it caused a big drop in percent positives. Not quite ready to say things are declining but they don’t seem to be increasing so we’ll call it flat for now.
- California – Remains the most problematic state in the union. For the last two weeks, 12.2% of the tests were positive and that’s the highest since back in April when we didn’t do a lot of testing. There is some evidence that the rate may be starting to slow but the total for the last weeks is double what it was the previous two weeks before that so things are still increasing here at a pretty rapid rate.
- Hawaii – I might have jinxed them last time as they’ve seen a rise in cases and percentage of positive results over the last couple of days. For the last two weeks, it was 2.8% which is still low compared to other places but, for Hawaii, it is the highest since mid October which was the tail end of their late summer surge.
- Nevada – In the beginning stages of a decline but both cases and percentage of positives are trending down and have been for about a week.
- Oregon – Things were relatively flat in terms of cases from the 4th through the 17th but have started dropping since then. So it looks like they are also trending in the right direction.
- Washington – They look to have peaked on the 12th and have been declining since then. Cases are back to mid November levels. I can’t make much of percentage of positives because they went two weeks without reporting them and then dumped a bunch. That’s now all out of the graphs but we’ll probably see similar disruptions over the next two weeks.
Over the year while I’ve been tracking this (and data from the rest of the world as well), these waves resemble S-curve growth phases. You may start with some slow growth but then you hit a period where there is nearly exponential growth. Then you hit a region where you are still growing but at a much slower rate as you approach a peak. There is a peak/plateau for a bit and then things start to drop.
The exponential growth is the scary phase because the numbers look like they are going to go up forever. Right now, I’d suggest that California is the only place in that phase. Most of the rest of the states have gone through that and are in various other phases. A couple of them (Tennessee, North Carolina) don’t really seem to fir the s-growth model but we still need to watch.
Outside of a few places, there is no evidence of a post Thanksgiving surge if you define that surge by another exponential leg up. To me, the situation continues to show signs of improvement. Then again, I am wearing my rose colored glasses.

